Another strong week for US equities
It’s a familiar refrain but spot on as ever: American shares can’t be beat, at least not yet.
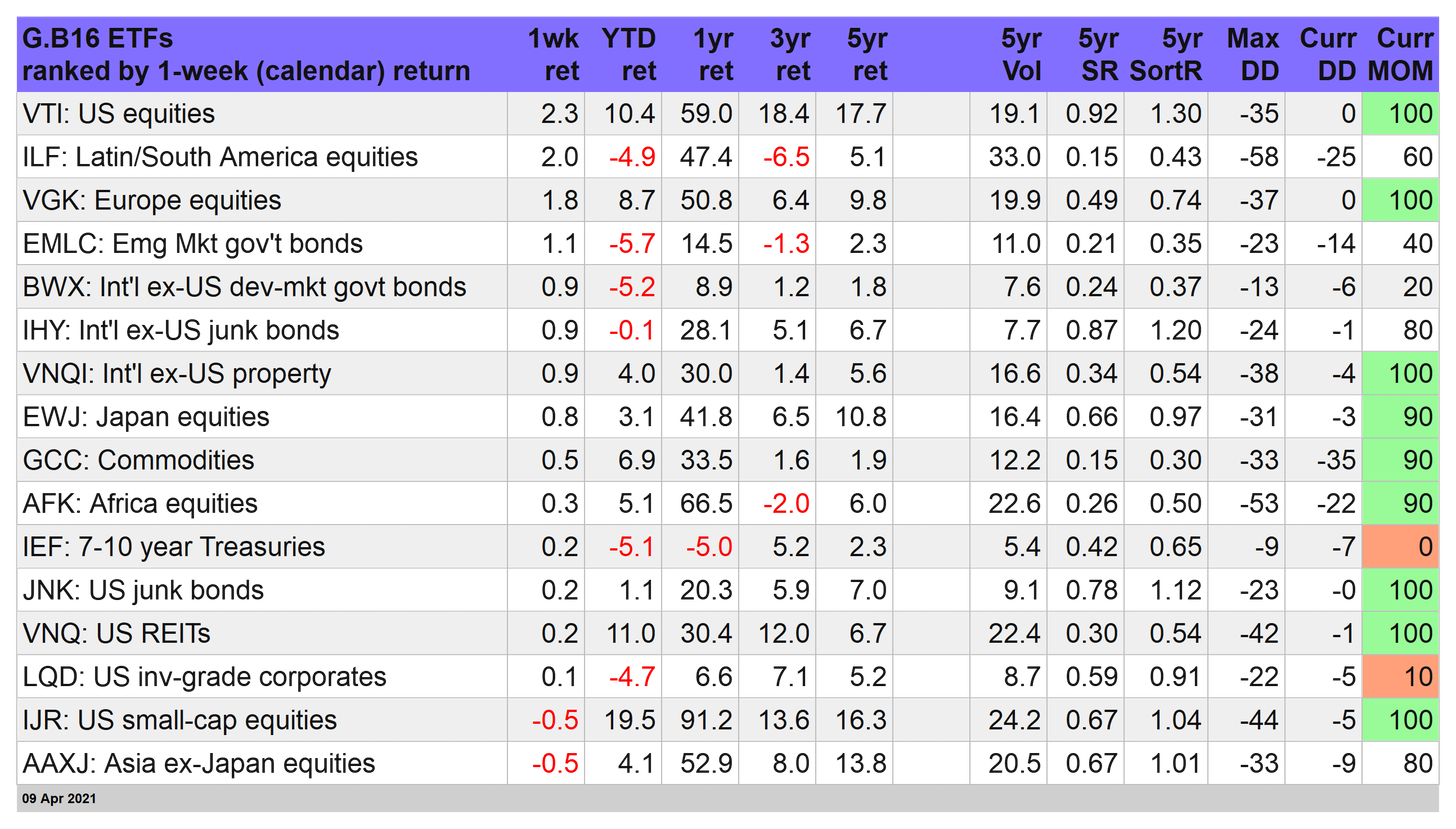
Once again, our main proxy for US shares was the top weekly performer for trading through Friday, Apr. 9 relative to our 16-fund global opportunity set that proxies the major asset classes on a global basis.
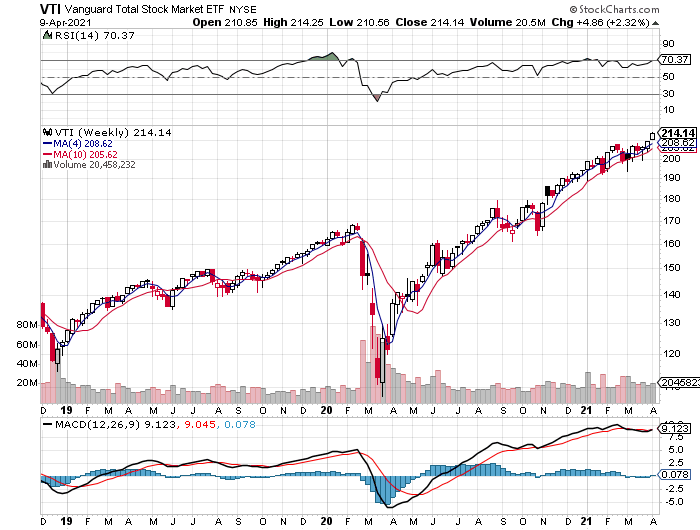
Vanguard Total Stock Market Index Fund ETF Shares (NYSE:VTI) rallied 2.3%, closing at another record high. The recovering economy, combined with continued signals of no rate hikes from the Federal Reserve, remain a potent brew for juicing animal spirits in America. The potential for hotter inflation in this week’s March report on consumer prices could rattle the bulls, but for the moment US stocks are priced for perfection.
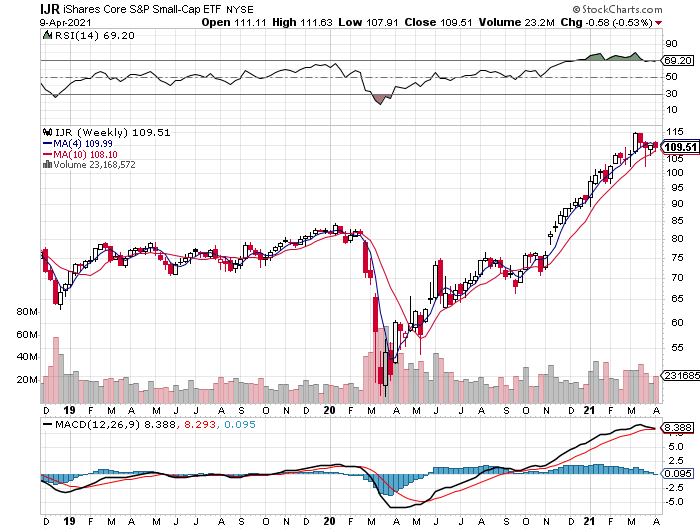
Beneath the big-cap surface, however, a bit of turbulence emerged. Small-cap stocks didn’t participate in this week’s broad market rally. The iShares Core S&P Small-Cap ETF (NYSE:IJR) slipped 0.5%—one of two weekly losers. After rallying sharply for much of the year through early March, IJR has pulled back and held in a trading range for the past three weeks. It’s premature to declare the rebound in small caps over, but it’ll be useful to see how IJR reacts to this week’s inflation data.
Meantime, the rise in interest rates remains on hiatus. The 10-year Treasury yield continued to tread water for a third week, edging down to 1.67% and holding just below the recent one-year high for this maturity.
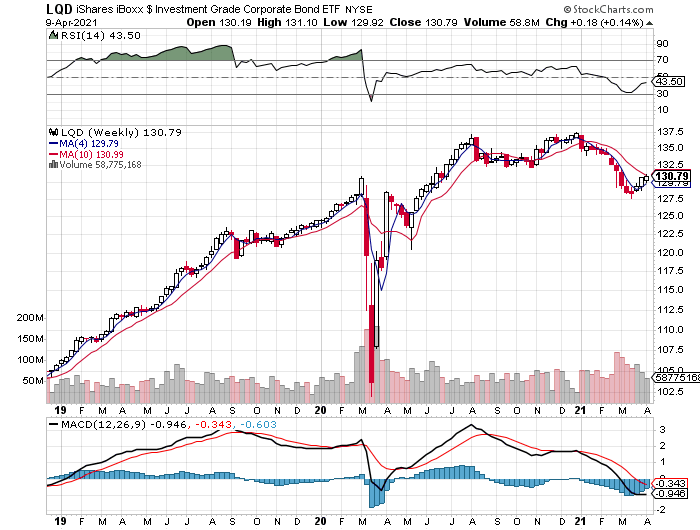
Putting the kibosh on higher rates remains helpful for iShares iBoxx $ Investment Grade Corporate Bond ETF (NYSE:LQD), which rallied for a third week. That’s the longest run of gains for LQD since December.
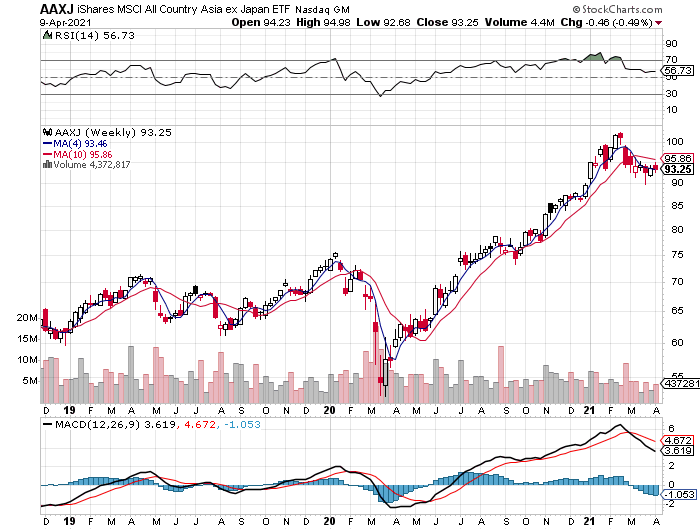
Overall, it was a good week for most of the global markets. The only losers for our 16-fund global opportunity set: US small caps (IJR) and shares in Asia ex-Japan via iShares MSCI All Country Asia ex Japan ETF (NASDAQ:AAXJ), which slipped 0.5%. With AAXJ’s four-week average holding well below its 10-week counterpart, the bulls are on the defensive in this corner.
Strategy benchmarks continue to run hot
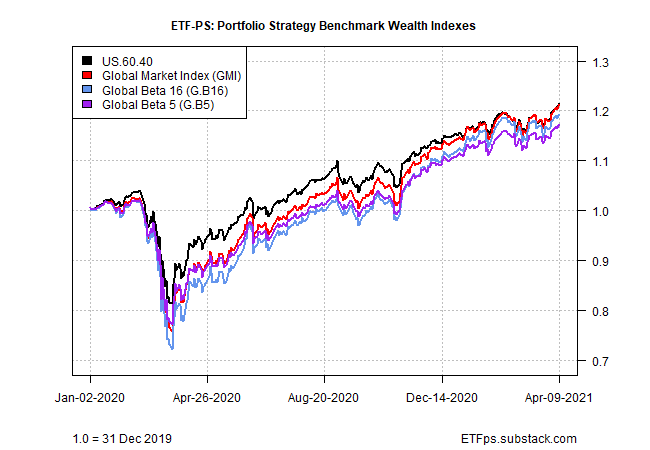
With most of the global markets in the plus column last week, all four of our portfolio strategy benchmarks posted solid weekly gains. For details on all the strategy rules and risk metrics, see this summary.
Leading the field: Global Market Index (GMI), an unmanaged portfolio that’s allocated to all the major asset classes in market-value weights. Enjoying a 5.8% weekly advance, GMI remains comfortably in the lead this year vs. the other strategy benchmarks via a 5.8% total return so far for 2021. As a bonus, GMI ended the week at a record high.
Positive momentum remains red hot on all fronts for the strategy benchmarks per our proprietary MOM score. Given the strong returns so far this year, it wouldn’t be surprising to see the strategies pause/correct. But at the moment, markets seem to be anticipating blue skies ahead.
