Breakout for commodities
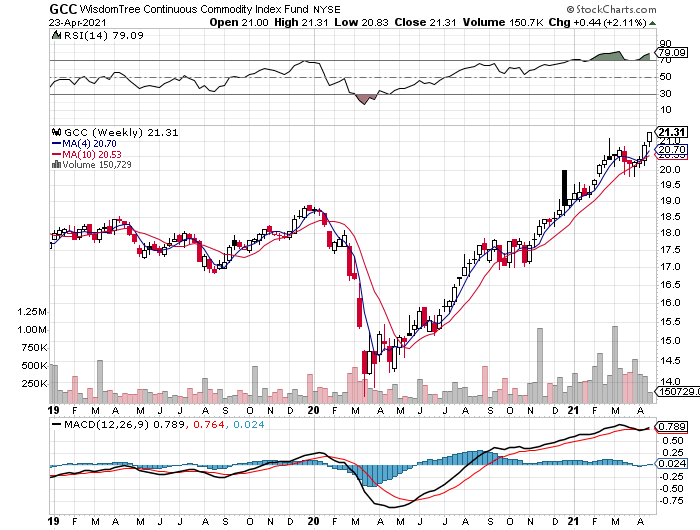
WisdomTree Continuous Commodity Index Fund (NYSE:GCC) has been trending higher for much of the past year and the good times kept rolling last week. GCC jumped 2.1%, closing on Friday (Apr. 23) at its highest price in nearly six years.
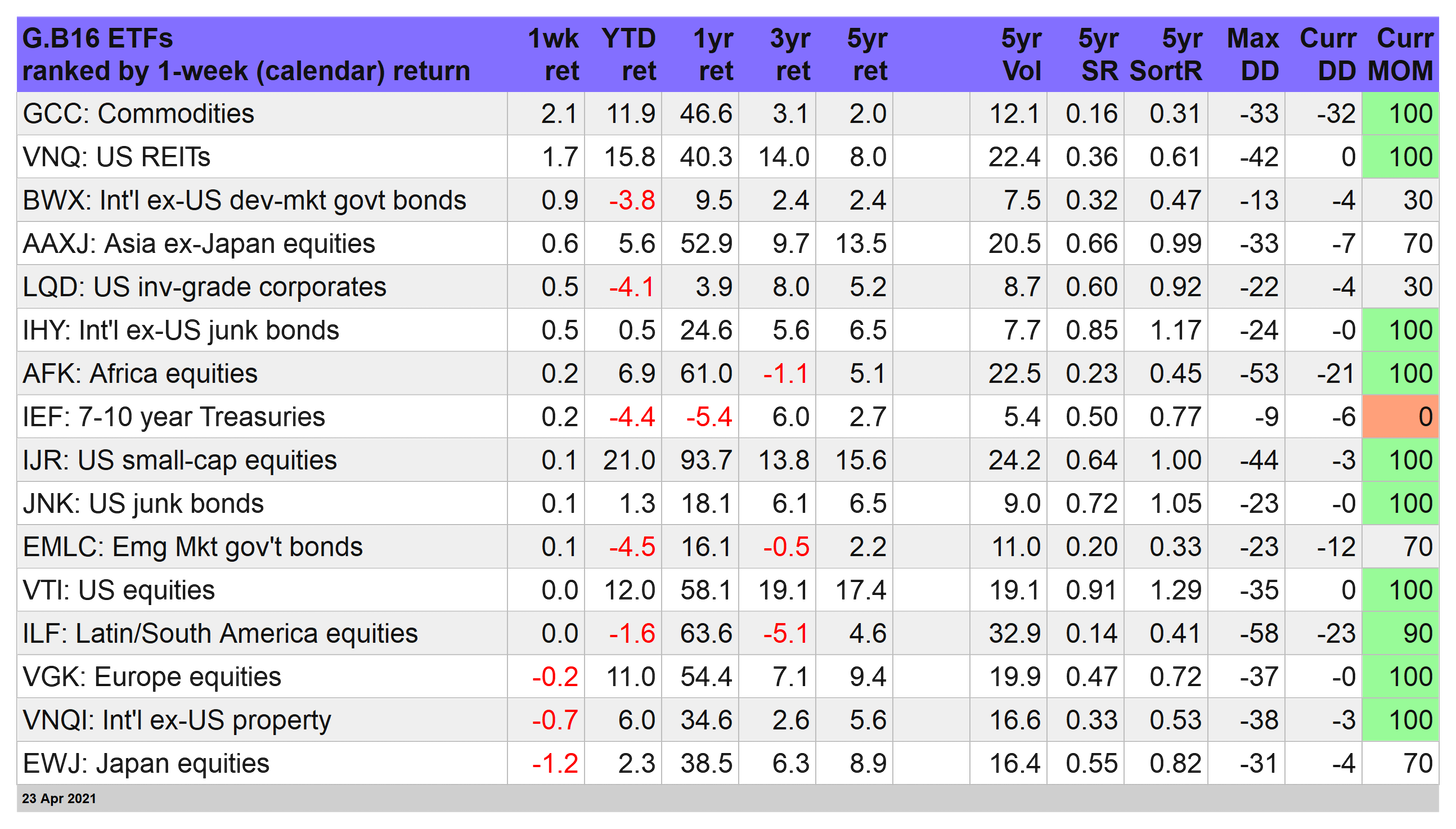
The equally weighted GCC also topped the weekly performance race for our 16-fund opportunity set (see table below). For the year so far, the ETF is up nearly 12%, the fourth-best performer for our primary funds representing the major asset classes.
A bullish driver of commodities prices lately: expectations that inflation is on the rise. An added boost for commodities: the US dollar remains weak: US Dollar Index closed Friday at its lowest level in over a month. The greenback and commodities tend to be negatively correlated, which at the moment favors the latter.
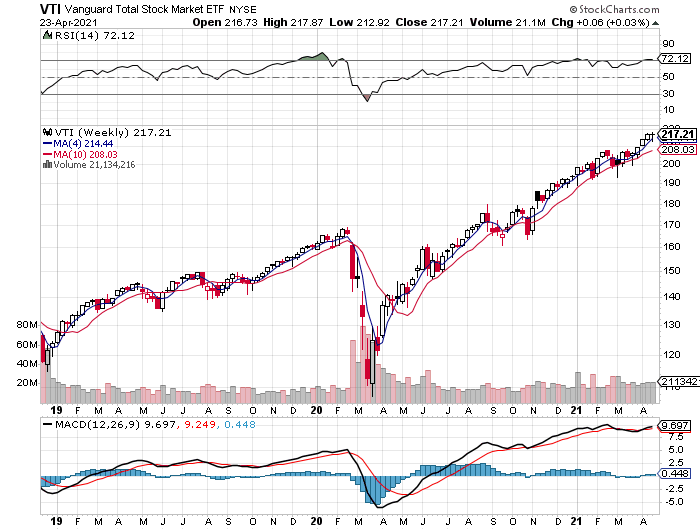
US equities broke their four-week winning streak, ending the week with no change, based on Vanguard Total Stock Market Index Fund ETF Shares (NYSE:VTI). Analysts continue to argue that US shares are overvalued, perhaps to the point of entering bubble territory. Nonetheless, from a trending perspective, there’s no sign that the party’s about to end.
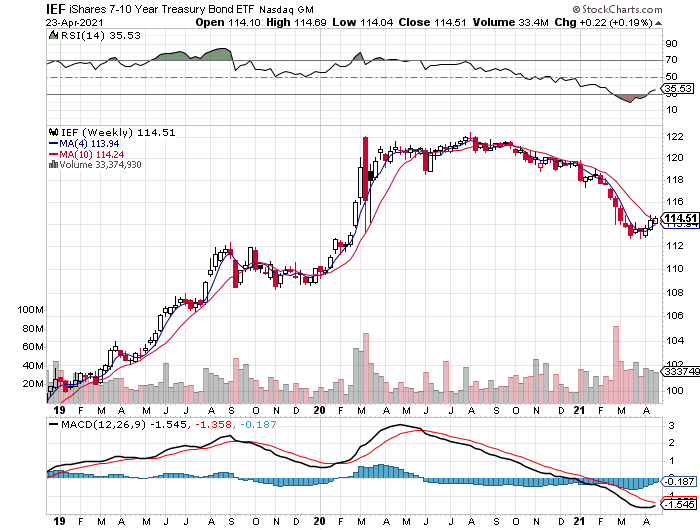
Meanwhile, the nascent recovery in Treasuries continues. Inflation risk may be rising, but so far it’s having no impact on the rebound in iShares 7-10 Year Treasury Bond (NYSE:IEF), which rose for a third straight week. For now, the bond market appears unpersuaded that higher inflation is sustainable beyond the next several months and a widely expected bounce due to “base effects.”
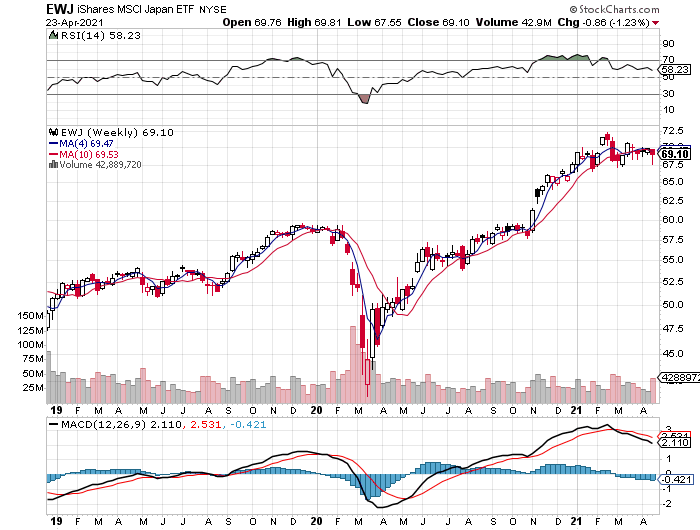
The weakest performer last week: Japan equities. The iShares MSCI Japan ETF (NYSE:EWJ) continued to be caught in a tight trading range, although that didn’t stop it from losing 1.2% last week.
Broader Is Still Better For Global Beta
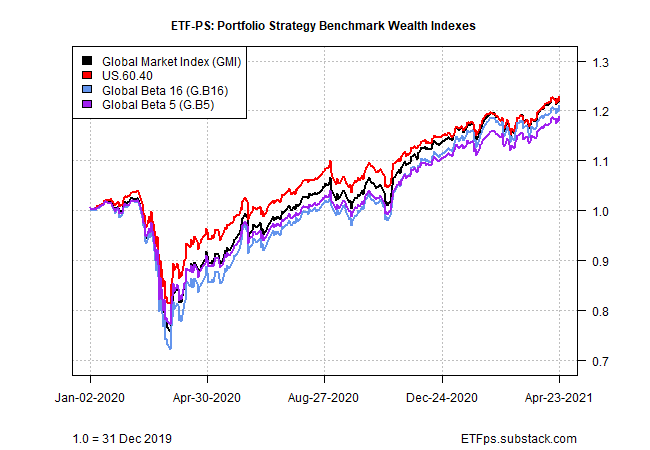
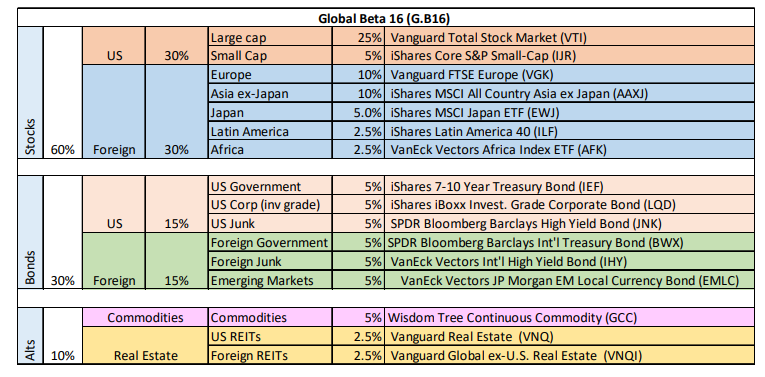
Our portfolio benchmark, based on our 16-fund opportunity set, (see table above and weights table below), continues to lead year to date. The 0.2% weekly advance for Global Beta 16 (G.B16) lifted the index to a strong 7.6% rally for 2021 so far. That’s modestly above the second-best strategy benchmark performer: Global Market Index (GMI), which holds a slightly different set of ETFs and is an unmanaged, market-weighted portfolio. For details on all the strategy rules and risk metrics, see this summary.
Meanwhile, the US-focused benchmark—the familiar 60/40 stock/bond mix (US.60.40)—continues to lag this year, posting a solid but last-place 6.1% year-to-date total return. As we noted the previous week, the recent revival in foreign assets (and other asset classes beyond US stocks and bonds) was delivering an unfamiliar challenge to America-centric investing: relatively weak results.
Are we at the dawn of an extended run of dominance for global asset allocation after a long relative performance drought? Unclear, but last week offered another reason to think that the dominance of all things US in asset-allocation land may be coming to an end for the foreseeable future.

