Rally In Risk Assets Ex-US: US stocks and bonds took a back seat to offshore rallies this week, providing some much-needed lift to the idea that holding a globally diversified portfolio is more than an outdated academic concept. But let’s not get ahead of ourselves. It’s too soon to declare the end has arrived for the long-running dominance of American risk assets on the global stage, but suddenly it’s easier to wonder if this week’s results are a preview of things to come.
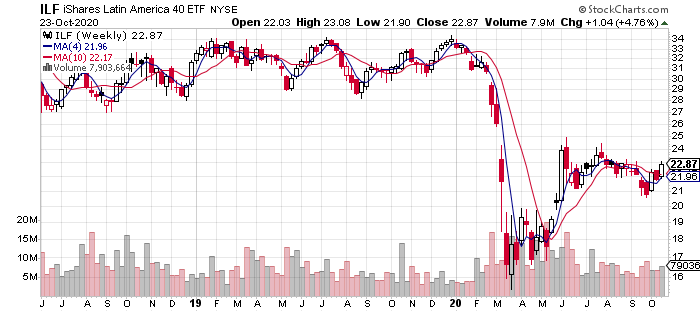
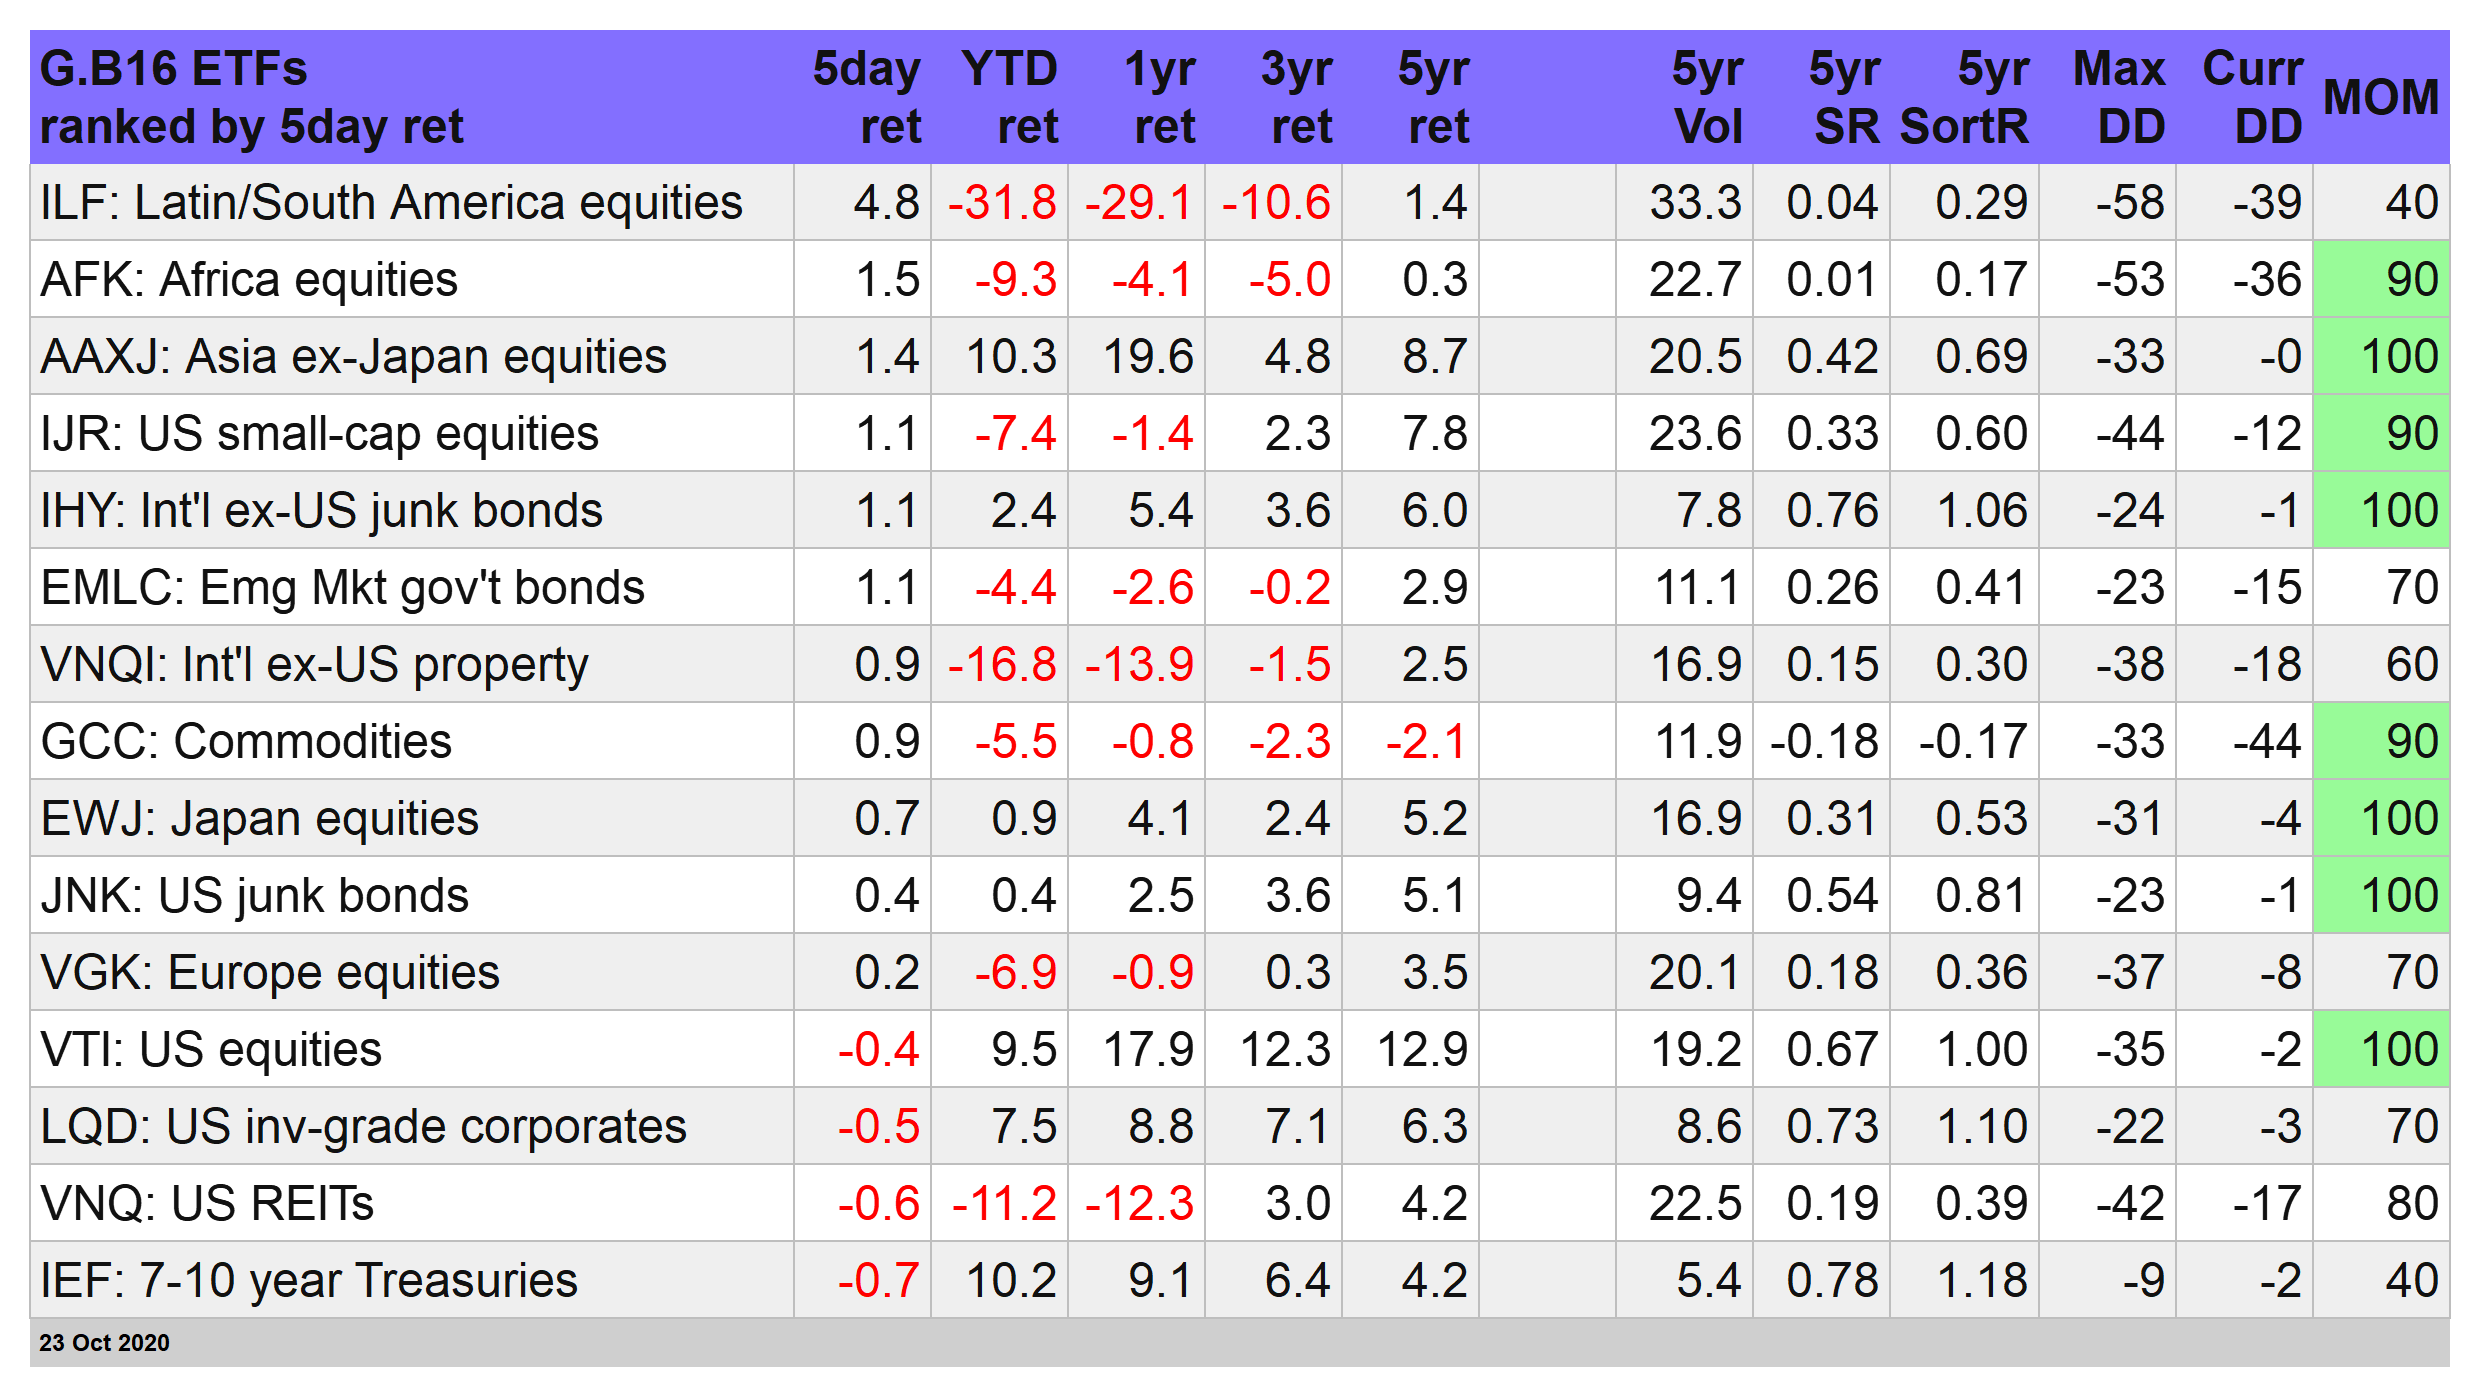
Leading the way higher this week for our standard set of global market ETFs: iShares Latin America 40 (NYSE:ILF), which rallied 4.8% for the five trading sessions through today’s close (Oct. 23). Impressive, although ILF still has a long way to go before it begins to impress on the performance front. Year to date, the ETF is down nearly 32%--the biggest loss in our primary global opportunity set. But for this week, at least, there are signs of life in one of 2020’s most battered regions.

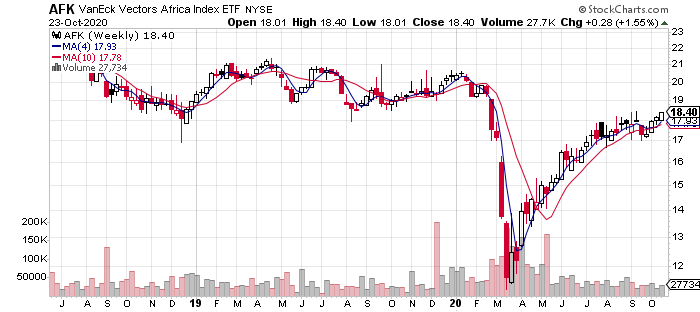
Stocks in Africa were the week’s second-best performer. In contrast, with ILF, VanEck Vectors Africa (AFK) not only had a good week (+1.5%), but it continues to post a strong upside momentum profile. That’s clear in the chart below and via our in-house momentum ranking system, which currently scores AFK at 90 (relative to a possible 100, the strongest upside reading) in the table that follows per the MOM column. ILF’s MOM score, on the other hand, currently ranks at a weak 40.


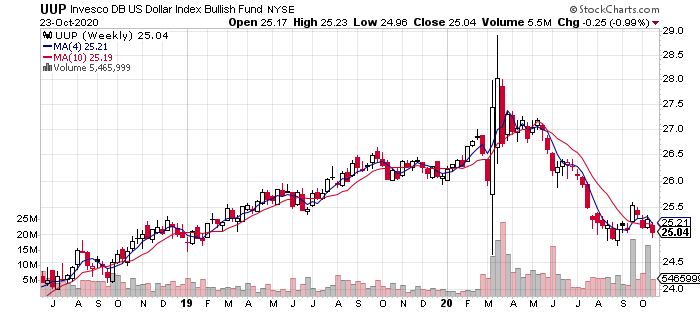
Part of the boost to foreign assets is the ongoing weakness in the US dollar (a positive factor for assets denominated in foreign currencies from a US investor’s perspective). The UUP fell 1.0% this week and looks set to test its previous lows set in August.

US assets overall either lost ground or posted relative mediocre results. The biggest setback on the global stage this week: US Treasuries via iShares 7-10 Year Treasury Bonds (IEF), which slumped 0.7%, which left the fund close to a four-month low. Not surprisingly, IEF’s MOM rank remains weak at 40 (vs. 0, the lowest possible momentum score).
US stocks also lost ground this week. Vanguard Total US Stock Market (NYSE:VTI) slipped 0.4%, the fund’s first weekly decline in the past month.
Broad Global Diversification Posts A Win: Turning to our portfolio benchmarks, Global Beta 16 (G.B16) was the only winner this week. This benchmark, which holds all the 16 funds above in a 60/30/10 equities/bonds/real estate and commodities mix, edged up 0.2%.

Our proprietary strategies delivered mixed results for week just ended. The top performer: Global Managed Volatility (G.B16.MVOL), which uses the 16-fund opportunity set listed above, rose 0.4% this week. The strategy continues to maintain a risk-on posture for all 16 positions, which explains its strong 19.3% year-to-date gain and the highest MOM score: 100.

Global Managed Drawdown (G.B16.MDD) also edged higher this week, adding 0.2%, which leaves it with a 12.1% advance so far in 2020. Five of the 16 funds held by the strategy (same opportunity set as G.B16.MVOL) are currently risk-off positions, including the latest sell recommendations for the portfolio: Vanguard US Real Estate (VNQ) and iShares US iBoxx $ Investment Grade Corporate Bonds (LQD). Meanwhile, three formerly risk-off holdings switched to risk-on as of today’s close: foreign high-yield bonds (IHY), emerging markets government bonds (EMLC) and the week’s top performer: iShares Latin America 40 (ILF).

For additional perspective, here’s how BlackRock’s four varieties of global asset allocation ETFs fared. Overall, a flat-to-down performance for the week in this corner.

The key events to watch next week include, of course: election polls. For the moment, Joe Biden continues to (mostly) lead President Trump by varying degrees, depending on the poll. That’s been the state of affairs for months and so any substantial change, with less than two weeks to go before the election, could be market-moving news.
Otherwise, rising cases of coronavirus in the US and in Europe will remain front and center. Ditto for next week’s busy schedule of US economic reports, including the government’s initial estimate of third-quarter GDP (scheduled for Oct 29). Economists tell us that a strong, perhaps record-setting gain is expected. Briefing.com’s consensus forecast: +30.0% on an annualized basis. That compares with Q2’s record 31.4% loss. Even if the forecast for Q3 is right, the bounce will be tempered by what’s come before. But with analysts looking for an unusually strong increase in the nation’s broadest economic measure, it’s a good time to consider how the crowd might react if the data disappoints. Something to ponder over the weekend as autumn deepens across the northern hemisphere.
