This week another pundit again confirmed the economy is headed toward a recession. Rail, a real time economic indicator is now negative year-over-year regardless of interpretation.
Many view the economy with their favorite pulse point – say GDP – which is a very, very lagging indicator. Hello people, GDP is continually revised, and the last recession was called a year after the revised and revised GDP estimate at that time started contracting.
Looking at the myriad of non-GDP economic releases individually will drive one crazy as elements of the economy are not necessarily in phase with each other, and there are reasons which depress or fuel each economic segments.
Overall, the economy seems to be more robust then the weak growth indicates – but one must look for outliers which would indicate an alternate conclusion.
The pundit repeating his recession call this week was Gary Schilling. He also called for the S&P to fall to 800 (a 43% fall).
My nagging concern that there are few USA economic segments where growth is accelerating, all while the stimulus effects ebb and global growth projections are slowing.
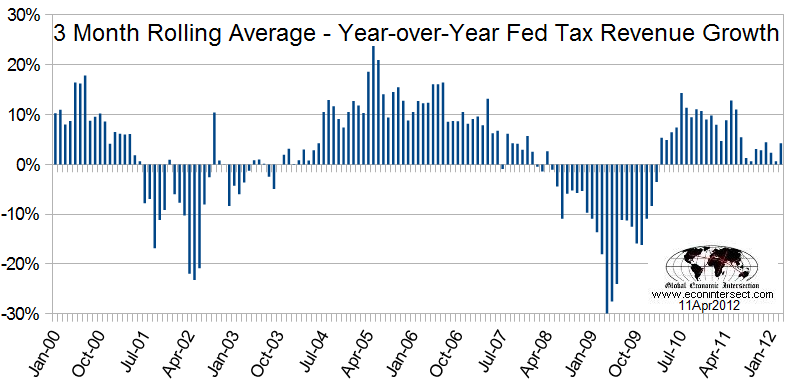
A timely way to look at the economy is the Federal Revenues (which are mostly from various taxes). Monthly Federal income is reported shortly after month end, and logic dictates that as long as the tax rate laws are unchanged – it should be a good indicator of the economy
One problem using tax revenues is that they are noisy – and to obtain any sort of coherent output requires viewing the revenues as a 3 month rolling average. On the other hand, backward revision is statistically unnoticed if it happens at all.
Looking at Federal Revenues as a recession indicator – they began contracting year-over-year in July 2001 (vs the NBER recession start date of March 2001 which was announced on November 26, 2001), and in February 2008 (vs the NBER recession call start of December 2007 which was announced in December 1, 2008). The point here is that even being a little late in indicating a recession had begun, that monitoring Federal Tax Revenues is far faster (and more accurate in real time) than using the continuously revised GDP as a metric to understanding the real economy.
Growth in Federal Revenues over the last 8 months has averaged an annual rate of growth of 2.8% – and the 7 month growth trend is more or less flat (stable). The scary part is that historically this low rate of Federal Revenue growth is not normal.
The whole economy just seems not to be acting in a historically normal manner. Those pundits that have called a recession are looking at trusted economic elements which are indicating contraction. I trust nothing at this point in this New Normal recovery.
Other Economic News this Week:
The Econintersect economic forecast for April 2012 shows a less good growth. There has been a degradation in our government and finished goods pulse points.
ECRI has called a recession. Their data looks ahead at least 6 months and the bottom line for them is that a recession is a certainty. The size and depth is unknown but the recession start has been revised to hit around mid-year 2012.
This week ECRI’s WLI index value improved to 1.4 – the best index value since August 2011. This is the twelfth week of index improvement. This index is now indicating the economy six months from today will be marginally better than today.
Initial unemployment claims essentially increased from 357,000 (reported last week) to 380,000. Historically, claims exceeding 400,000 per week usually occur when employment gains are less than the workforce growth, resulting in an increasing unemployment rate (background here and here). The real gauge – the 4 week moving average – rose from 361,750 (reported last week) to 368,500. Because of the noise (week-to-week movements from abnormal events AND the backward revisions to previous weeks releases), the 4-week average remains the reliable gauge.
Data released this week which contained economically intuitive components (forward looking) were rail movements and the import portion of the trade balance . Although overall rail is contracting year-over-year, economic related components are weakly improving. The growth in imports has always been a positive sign of USA economic growth.
Weekly Economic Release Scorecard:
Click here to view the scorecard table below with active hyperlinks
Bankruptcy this Week: Reddy Ice Holdings and Reddy Ice Corporation
Failed Banks this Week: None
- English (UK)
- English (India)
- English (Canada)
- English (Australia)
- English (South Africa)
- English (Philippines)
- English (Nigeria)
- Deutsch
- Español (España)
- Español (México)
- Français
- Italiano
- Nederlands
- Português (Portugal)
- Polski
- Português (Brasil)
- Русский
- Türkçe
- العربية
- Ελληνικά
- Svenska
- Suomi
- עברית
- 日本語
- 한국어
- 简体中文
- 繁體中文
- Bahasa Indonesia
- Bahasa Melayu
- ไทย
- Tiếng Việt
- हिंदी
The Economy Is Not All That Hot
Published 04/14/2012, 11:06 AM
Updated 05/14/2017, 06:45 AM
The Economy Is Not All That Hot
3rd party Ad. Not an offer or recommendation by Investing.com. See disclosure here or
remove ads
.
Latest comments
Great piece. Thanks for the insight - it's what I needed to help me get prepared for Monday.
Install Our App
Risk Disclosure: Trading in financial instruments and/or cryptocurrencies involves high risks including the risk of losing some, or all, of your investment amount, and may not be suitable for all investors. Prices of cryptocurrencies are extremely volatile and may be affected by external factors such as financial, regulatory or political events. Trading on margin increases the financial risks.
Before deciding to trade in financial instrument or cryptocurrencies you should be fully informed of the risks and costs associated with trading the financial markets, carefully consider your investment objectives, level of experience, and risk appetite, and seek professional advice where needed.
Fusion Media would like to remind you that the data contained in this website is not necessarily real-time nor accurate. The data and prices on the website are not necessarily provided by any market or exchange, but may be provided by market makers, and so prices may not be accurate and may differ from the actual price at any given market, meaning prices are indicative and not appropriate for trading purposes. Fusion Media and any provider of the data contained in this website will not accept liability for any loss or damage as a result of your trading, or your reliance on the information contained within this website.
It is prohibited to use, store, reproduce, display, modify, transmit or distribute the data contained in this website without the explicit prior written permission of Fusion Media and/or the data provider. All intellectual property rights are reserved by the providers and/or the exchange providing the data contained in this website.
Fusion Media may be compensated by the advertisers that appear on the website, based on your interaction with the advertisements or advertisers.
© 2007-2024 - Fusion Media Limited. All Rights Reserved.
