
After the Soviet invasion of Afghanistan in 1979, the Russians became hyper-aware of US and NATO counter movements. There was an increase in bellicose rhetoric on both sides, and the Andropov years had left the Soviet leadership weakened by economic stagnation increasingly worried that the US just might launch a first-strike attack.
The Communists developed a systematic intelligence approach in response. It’s not like the movies; you can’t just decide one day to launch an assault that would alter human civilization forever. Preparations were required, even if they could be made surreptitiously.
If there was to be a nuclear surprise, what would the Americans do beforehand? How would Western leadership, command and control functions, be moved and prepared? Which specific assets would have to be readied and put into service? Etc.
A great deal of Russian counterintelligence effort went into identifying and then tracking these individual pieces of the Cold War chessboard. The Soviets would keep up on as many as they could thinking that if enough of them moved simultaneously in certain ways that could signal increasing war readiness on the part of the United States or Britain. This method of interpretation might even deliver a definitive enough prewar signal that the Communists could then use to hit the West before they got the chance to attack.
This process was actually put into action in late 1983. Operation Able Archer was meant to be a large scale NATO war game realistic enough in depth as well as detail that would simulate, ironically, a Soviet attack. It wasn’t just US Navy ships maneuvering together with British and French counterparts, it involved military assets of all kinds as well as participation by political leaders. To the Soviets, it sure looked like the real thing with warning signs going off everywhere in progressively more uniform fashion.
Fortunately, it was merely a close call. Though subsequently declassified Russian documents indicate just how far the Soviet leadership had come to believe about Able Archer as if it were really a war pretext, these were ultimately false signals over interpreted by the tense environment.
Though the stakes aren’t so consequential, our challenge in trying to identify deflation or reflation is similar. There is no one price or indication that clearly defines the sharp boundaries between one or the other. Just as there wasn’t a perfect system for identifying actual war preparations between Cold War adversaries, we are handed a less-than-perfect, often muddied projection of where these cycles may be swinging back and forth.
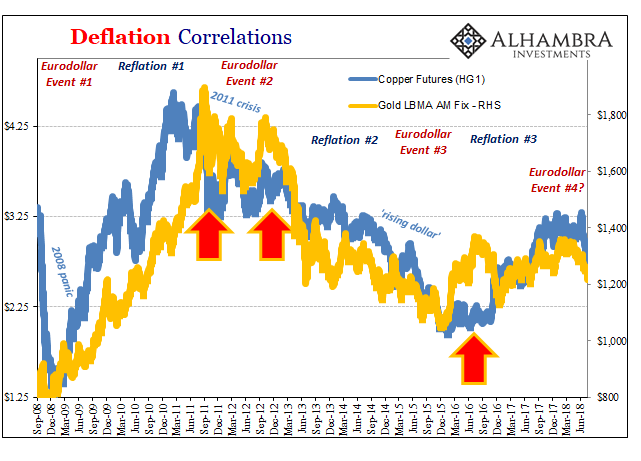
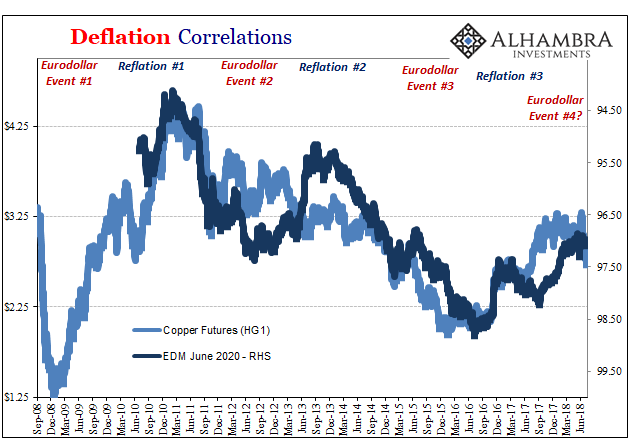
Since the overriding goal is to identify the severity of monetary disruption, it makes sense to start in metals. Textbook deflation is often a commodity affair, so copper and gold being two parts of money and economy are as good a first intelligence as any. As you can clearly see above, there is an overall uniformity in both that matches pretty well the history of the last ten years.
Some disagreements stand out, as I’ve labeled above. Gold tends to deviate from copper when central banks are more heavily involved. That makes some intuitive sense for individual circumstances. In 2011 as 2012, the first two arrows, many believed in the potential effectiveness of QE’s in the US and promises or LTRO’s in Europe. Gold was pushed up in defiance of copper because people really thought in a financial setting this was all money printing and therefore nontrivial risks of inflation.
Copper, however, showed otherwise. QE might have made an imprint on expectations but after the second one in the US sentiment didn’t do anything direct for the economy.
What therefore stands out is Reflation #2, the period surrounding the so-called taper tantrum. As noted before, while that was going on there was a pretty clear deflationary signal running underneath it the whole time. Here were two very important indications showing as constant deflation, yet markets moved as if an inflationary/recovery breakout was somehow still possible. Efficient markets.
In the sense of at least copper and gold, there was no Reflation #2 nor was there really a Eurodollar Event #3 – that last was merely a continuation of the 2011 crisis of Eurodollar Event #2, a largely unbroken deflationary string from early 2011 running all the way to the middle of 2016. I think that explains a lot about the proportions of both, as well as why despite so much good news in the US labor data and even GDP in 2014 it never amounted to much for turning the economic baseline upward.
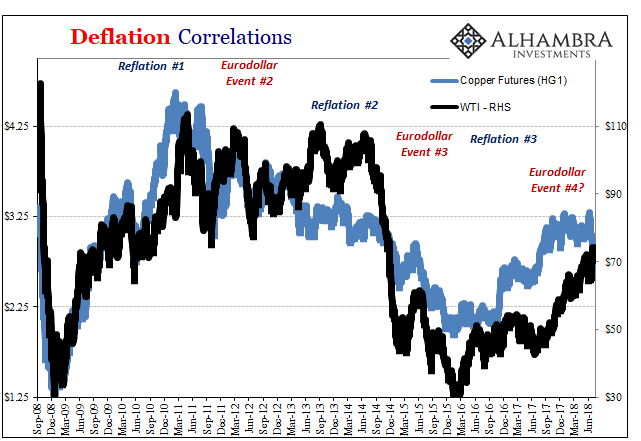
Gold and copper, however, were not decisive signals. Reflation #2 does show up in things like crude oil, which isn’t something that can just be ignored. Also noted before, the difference between copper and WTI during that time was almost certainly the difference between economic perceptions (US and Europe appearing to recover from downturns in 2012) and monetary perceptions (bank reserves weren’t money and therefore deflation would only continue and eventually each economy would be forced to recognize it).
These differences also carried on greater international dimensions, creating several contrary indications beyond just oil – though perhaps related.
So, of the four chess pieces shown above, in 2013-14 two show up as deflation and two as reflation. Given that the global economy’s tendency is for growth, the default or tie goes to that side. It was a reflation signal, but not a very strong one.
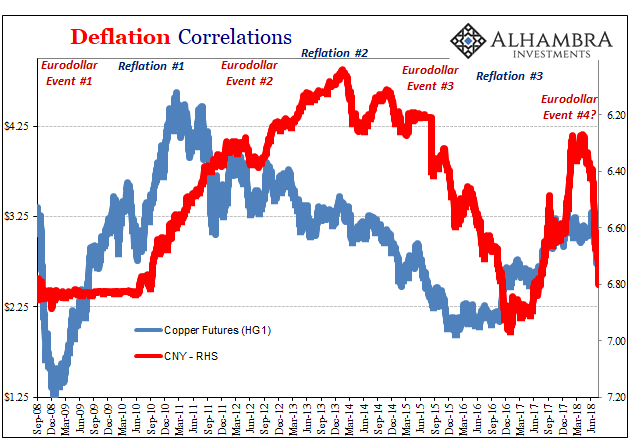
But it also set up the world for the nastiness of Eurodollar Event #3, the “rising dollar.” By the middle of 2014 when oil turned, all four were then not just facing in the same direction they were all moving downward very quickly; a very strong deflationary signal somehow ignored worldwide. It shouldn’t have been much of surprise, then, that the “rising dollar” period ended up being so bad in its totality (CNY DOWN = BAD was much more than CNY). It was as if 1983’s Able Archer had been the real thing, leaving more than few places devastated.
We can keep adding more than just these four crucial indications. Things like eurodollar futures or the yield curve fill out a more comprehensive “intelligence” list of indications to watch, but generally they have fallen into the general outlines of these others.
The irony of using 2020 eurodollar futures is just how easy all this is in hindsight. It’s far more difficult, as the Soviets found out, this ad hoc type of system in real time. Even seemingly clear signals can in reality be muddy enough.
Reflation #3, I think, is one of those instances – and how we got to the proportions of such inflation hysteria. Of the now five targets I’ve included, in 2017 all of them were on the reflation track. On the surface, that seems pretty profound, a uniform signal perhaps like globally synchronized growth.
Yet, when we look at them in wider context and in greater detail, we realize that though everything was in lockstep it wasn’t enthusiastic homogeneity. It was more like what Able Archer really was, meaning that you could tell the operation was a war game upon closer inspection, as realistic as they might have tried to make it.
In the same way Reflation #3 was indeed heading in the right direction, it was more “reflation” than the actual thing, never really putting in a “V” underneath anything. The signal was uniform in that respect, too, akin perhaps to a unified dead cat bounce. There may be five cats on display above and all five in 2017 were bouncing at the same time, but they were all dead, too, while they bounced. If you looked close enough, you could see that they were. If you chose not to, hysteria.
I think that’s the most striking possible interpretation of this exercise, which I believe is useful. Reflation #3 was clearly some level of reflation, but when compared to Reflation #1 it was clearly so much less. That’s not something we should ignore, either.
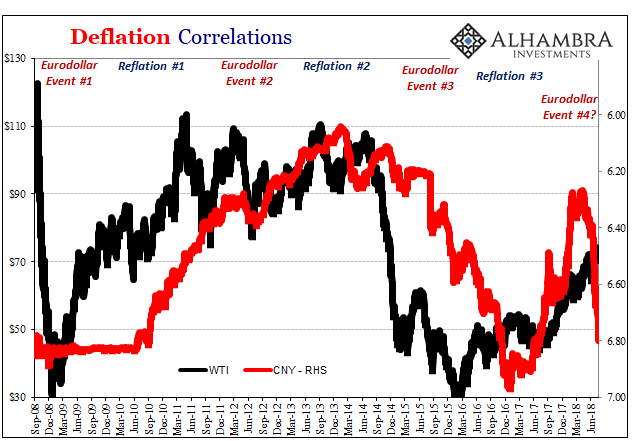
Now that the signals are in 2018 mixed again, with one still reflation (oil), three deflation (gold, copper, CNY), and one on the fence (EDM, though the eurodollar curve shape may override the price signal alone) we have a prospective setup more like 2014 than may otherwise appear.
In other words, even though Reflation #2 was undermined by key deflationary signals the whole time, Reflation #3 has been by the lack of enthusiasm during the synchronized bounce. Neither #2 nor #3 have been strongly positive indications, both undermined if by different factors. Thus, might we expect if all of them harmonize again like for the last “rising dollar” it could get pretty ugly all over?
Only time will tell. Though it won’t mean nuclear war and the possible annihilation of humanity, a positive deflation signal that could mean another, a fourth, global deflationary episode isn’t likely to be much fun. With the world in the state it’s already in, oh boy.
The stakes aren’t nearly as high, but they aren’t all that much less, either. Eurodollar Event #3 brought us Brexit, Trump, populists in Italy and Germany, renewing authoritarianism in China, etc., a growing general sense of worldwide dissolution. Like the eurodollar system itself, further and deeper fragmentation. Eurodollar Event #4 could bring things even more chaotic, or it could be the catalyst for actual answers and something truly positive. Like 1983, not all hope is lost.
But we would have to bet on Economists and central bankers for it to happen.
