Its been a fairly solid start to the new trading week here in Australia, with the ASX 200 pushing above 6300 and overlooking yesterday’s 2.3% decline in China. Concerns around future stimulus from Chinese officials saw traders hitting the profit switch after Friday’s regular Politburo signalled a far less dovish stance from officials. That said, we are not seeing follow-through selling in Chinese equity markets today, with the CHINA50 index still holding the 5-week EMA, and has done since mid-January. So, as long as the bulls average into this marker then the bull trend remains – should this reverse, weakness in the Chinese market may end up influencing global equity markets, increasing implied volatility and causing a hunt in safe-havens.
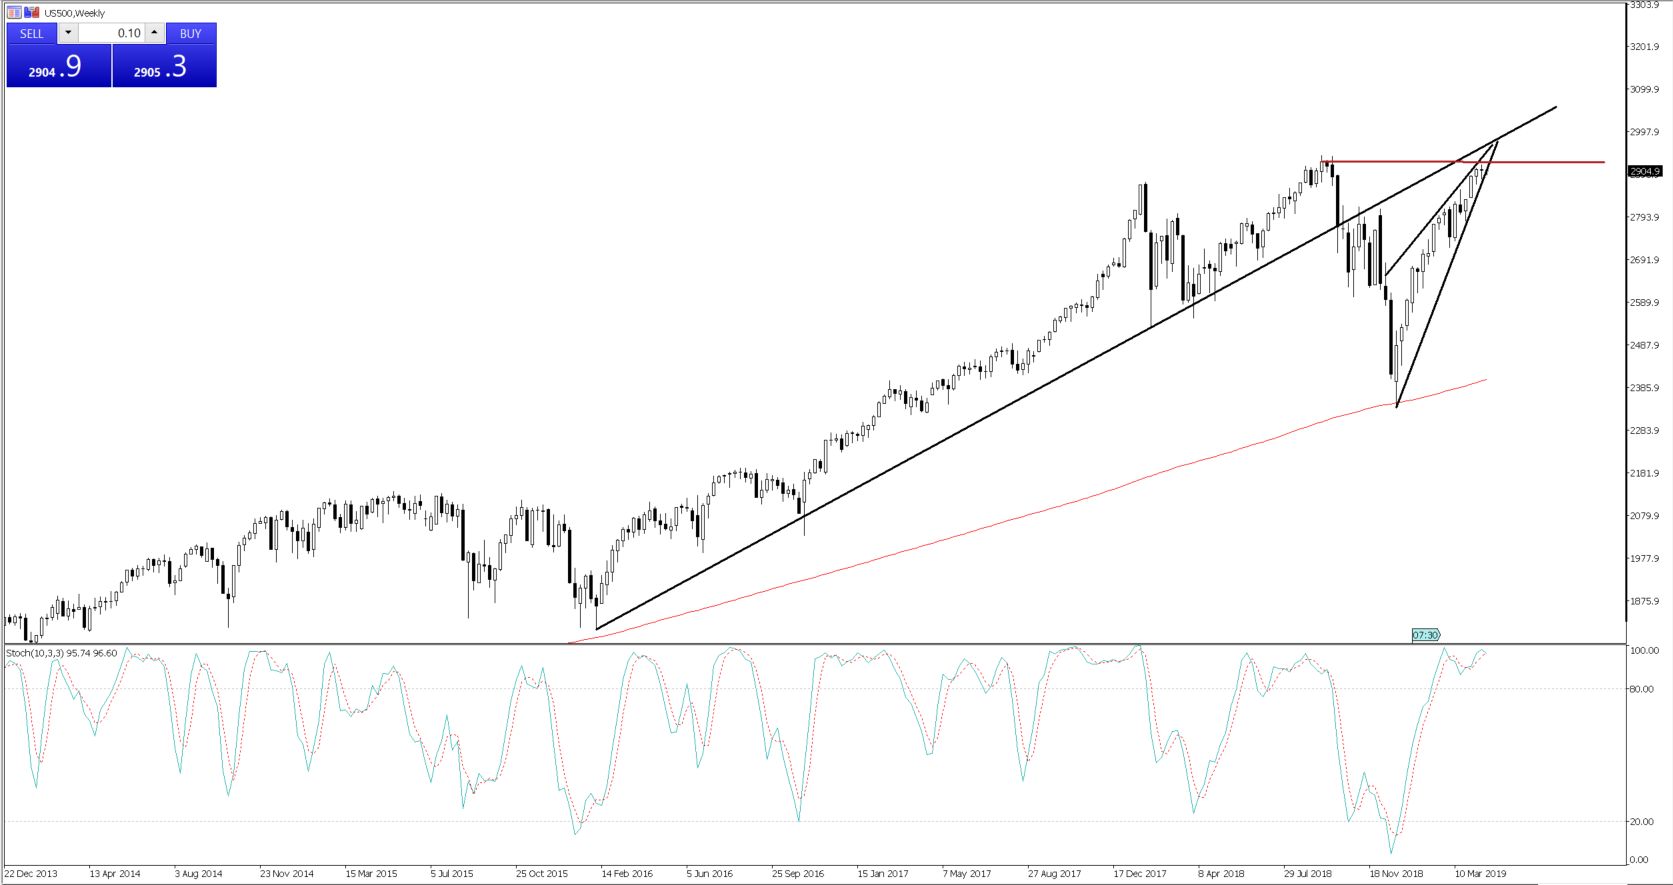
The bears have been keen to point out Friday’s record inflow into the 20-year US Treasury ETF (TLT). Granted, we haven’t seen a huge follow-through bid overnight in the actual bond market (UST10yr closed up 2.8bp), but that looks to be a function of higher oil and gasoline prices. The set-up in the S&P 500 (US500 on MT4/5) is one that is front and centre, and specifically, I have the weekly showing the set-up and structure. In the absence of any tier one data to drive this week, and with much fundamental news in the price, earnings take on increased relevance and with 157-odd companies due to report and the S&P 500 trading on 16.8x forward, there is very little room to disappoint. Having been an equity bull of late, it feels like the wind of change is upon us – we just need the price to react and confirm.

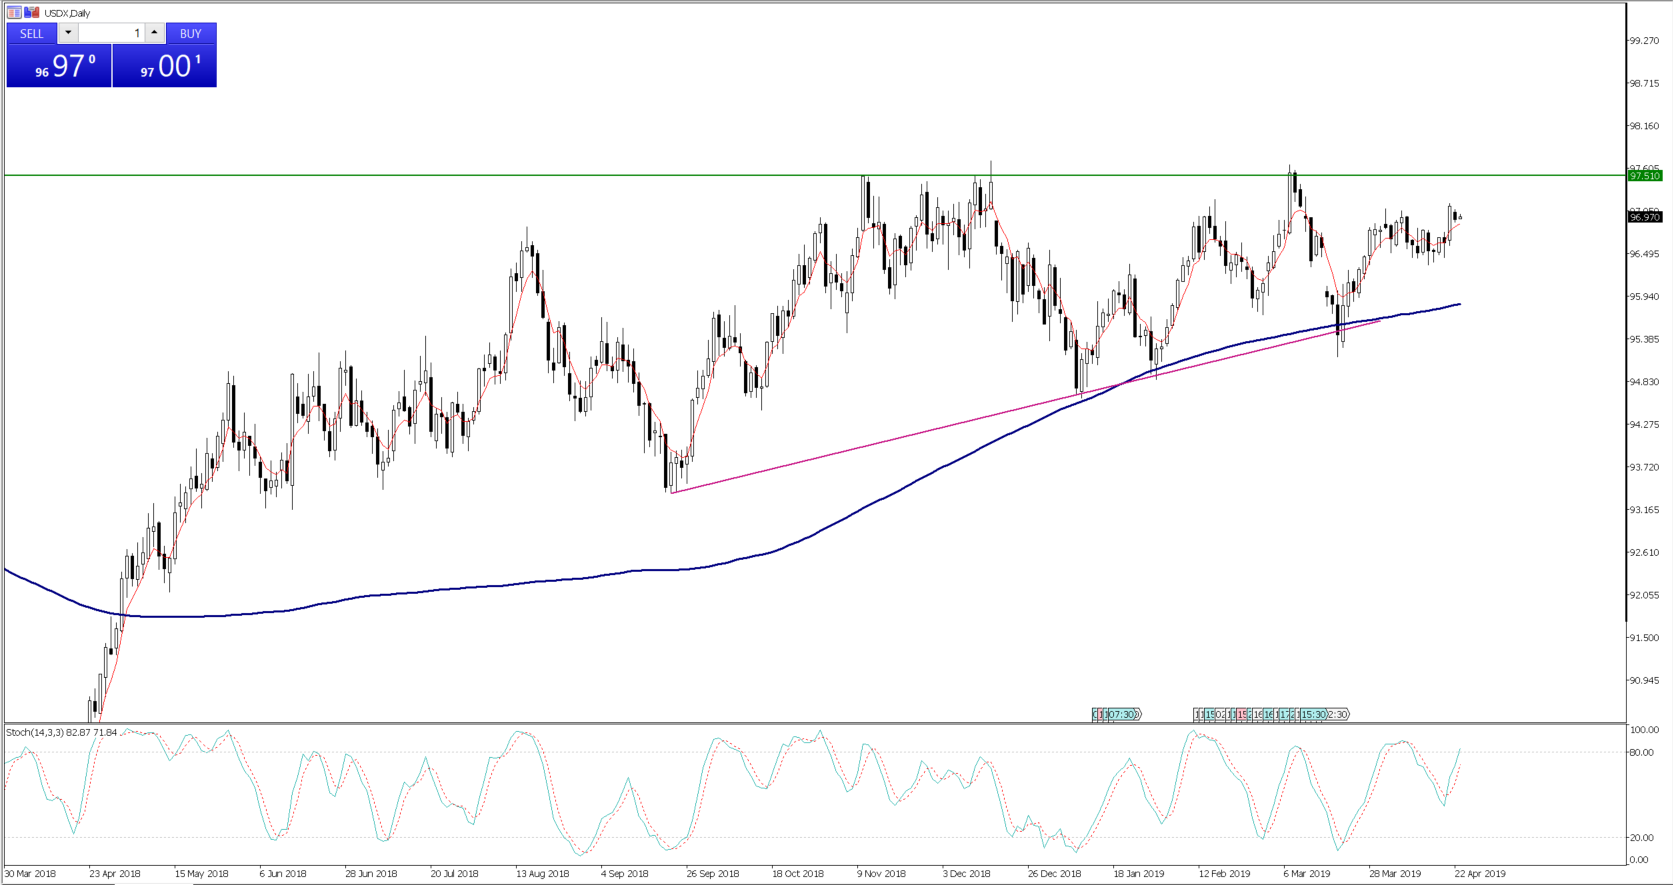
Another key chart that defines so much of the overall trading view and asset allocation in markets is that of the USD. I spoke about Fed policy and the USD in depth. It seems increasingly clear that Fed policy is too tight, and may need an insurance rate cut in Q3 or Q4, but core PCE into 1.5% is our trigger here. Whether we see the market reacting soon will be clear enough in the USDX chart and all eyes fall on 97.70, where a break could hold sizeable ramifications to broad markets and in a world of subdued growth could be the trigger for higher vols.

Energy is another on the watch-list, and our flows have certainly picked up in both Brent and WTI crude. The pro-traders have been trading the Brexit-WTI spread, buying Brent and shorting WTI crude, as a pairs trade and looking to net the outperformance of Brent. I like this trade, as Brent crude is obviously far more responsive to the pressures being enforced onto Iran and the formal deterioration of OPEC as a cartel.
Being long crude comes with risk, as the market is looking for that trigger when Saudi and UAE show greater clarity that they are actually increasing supply, to replace what Iran were exporting. That may not come in the immediate near-term and it feels like there may be some further juice to the upside. However, as always, we react to price moves and we know that the upside is capped as Trump is a low-price oil guy, and he will lean heavily on Saudi so as not to lift prices too high.
AUD/USD moves
There have been little moves in the AUD today, although we are certainly seeing interest in tomorrow’s Aussie Q1 CPI print. AUD/USD Implied volatility around the event is certainly not high and the expected move by tomorrow in the spot is 37-points. That said, this move implied the inflation print comes fairly in-line with consensus and vols ramp up if we get a miss. I have looked at the playbook here as a way of defining my risk into key events. It is a great way to think about risk as part of your trading process, and as defined below, when the outcomes are out of our control and amount to a flip of a coin, reducing exposures is often a good idea. Anyhow, thought I’d share.
Australia Q1 CPI trading playbook
The significance of the event
With an ever-increasing debate around whether the RBA will cut interest rates, not just in 2019, but even as soon as Q219, a weak inflation print this Wednesday (at 11:30 AEST) could give the Reserve Bank increased ammunition and need to stimulate. Granted, the RBA has expressed that deterioration in employment trends are their dominant consideration for guiding the cash rate lower, but inflation is certainly a close second. Therefore, further evidence of disinflation and a more troublesome path for price pressures will, at the minimum, need to be partly offset by a lower AUD and that will likely come in a far more definitive signal in the bank's communication that rate cuts are coming.
As expected, last week’s March employment print rose marginally to 5%. However, it offered few new insights for the RBA into the “tensions” between a tight labour market and weak employment trends. It seems logical, then, that the Q1 inflation read takes on increased significance and as a key consideration for the RBA, it should be for AUD traders too.
Of course, we also have to consider if this inflation print isn’t as materially weak as some are expecting. Notably, after some market participants, perhaps incorrectly, felt last week’s weak New Zealand CPI print of 0.1% QoQ is indicative that Australia’s inflation rate may follow suit. One should consider then, how a less bad inflation print affects not just a market already short of AUD’s (source: CFTC data), but one also already positioned for rate cuts through this year. Therefore, a trimmed mean quarterly inflation print of 0.5%, or indeed above, will have traders questioning if the 18 basis points (bp) of cuts priced by August are too pessimistic, which, in turn, should support the AUD.
AUD playbook
As with any key economic release that, it’s the magnitude of the beat/miss that will influence expectations of future central bank policy changes, and pose potential duress to portfolios. Therefore, by way of managing risk, reducing position size and interest rate sensitive exposures into the inflation print is prudent. That said, the post-CPI release playbook could have longer lasting effects on the AUD, and offer a new opportunity. As is often the case in trading, reacting above prophesying.
I have used the quarter-on-quarter (QoQ) trimmed mean inflation print as my guide.
Economist’s expectations

Trimmed mean CPI of 0.3% or below – This would take the year-on-year pace to 1.6% and 15bp below the RBA’s forecasts of 1.75% yoy. This also opens the possibility that headline inflation could actually falls (QoQ) in Q1, and that may get the lion’s share of headlines. In this scenario, the implied probability of a June rate cut increases from 18% to around 35%. AUD/USD tests 0.7081 (the 61.8% Fibonacci of the March to April rally. The ASX 200 should rally towards 6300.
Trimmed mean CPI of 0.5% or above – The implied probability of a rate cut in the June RBA meeting decrease from 18% to 5%, with a more aggressive re-pricing of August and September rate cut expectations. AUD/USD should close above the 200-day moving average at 0.7185, with a possible test of the 17 April high. AUD/NZD longs would be preferred here, on the continued idea of central bank divergence with the RBNZ. EURAUD shorts would look attractive, although should the S&P 500 head lower then lower yielding FX may find better buyers.
Trimmed mean CPI of 0.4% - This takes the year-on-year pace of core inflation to 1.7% and in-line with the RBA’s own forecasts. With the RBA feeling unemployment remains at 5% until June 2020, and inflation running to forecast, this inflation print offers few new clues. It would validate the low implied volatility in AUD/USD and the expected move through the Wednesday expiry of 32-points.
Positioning and sentiment – We head into the CPI release with both hedge funds and asset managers short of AUD/USD, but not at extremes.

1-week AUD/USD risk reversals sit at -0.30, showing the skew in demand for AUD/USD put vols is greater than call vol, but this skew has been reduced and not far from YTD highs.
