Back in 2008, a speculative bubble burst. It was caused by large US banks gambling with depositors’ funds. It resulted in an economic collapse that it took almost a decade to recover from.
A little economic history: in the 1930s, the Glass-Steagall Act was passed that prevented banks from trading its deposits. By 2008, its provisions had effectively been eliminated by bank lobbyists. So banks started trading its deposits. What did they trade?
As we all know, there is a real estate cycle. It usually goes up for 4 years give or take and then down for a while. It had gone up for quite some time leading up to 2008 spurred on by bullish trading in “asset-backed securities” (ABS). What are ABS? They are “supposed” to be securities that have assets of equal or greater value backing them.
As it turned out, many of these so-called ABS had nothing backing them. Or even if they did, nobody could document where this backing came from. This was because they were bundled together and sold as packages and their documentation was lost. So when one of these failed in 2008, people wondered about other the backing for other ABS and the entire market collapsed. Keep in mind that banks, with no real controlling regulations, were trading them. That lead to runs on banks, and many of them collapsed.
2008 – 2009 Losses
And the fears resulting from the ABS bubble caused stock markets worldwide to crash. Back in 2009, I estimated a stock market wealth loss of $29 trillion. A friend of mine who worked at Bloomberg said “My Bloomberg terminal has a handy function for world market capitalization. It accounts for every stock on a public exchange.” Since October 2007, it put the global stock market loss closer to $36 trillion Ouch!
To get a total asset loss, we need to add to that $36 trillion to my estimated global real estate loss of $14 trillion. That means individuals globally lost $50 trillion in capital value. It was unprecedented! And in contrast to what just happened, it meant that people felt poorer. And with their retirement monies gone they understandably cut back on expenditures. And businesses in turn reduced investments. Because of these twin expenditure reductions, unemployment increased causing a further drop in income and further expenditure reductions.
Stimulus Packages
There was another important fact worth considering: in 2009, the Stimulus package was only $787 billion – Republicans blocked any further appropriations.
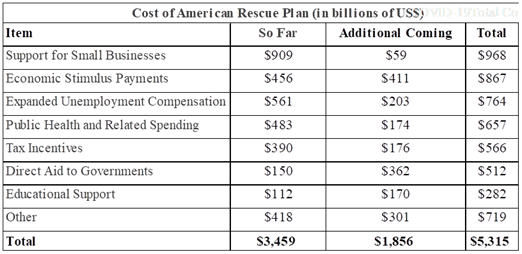
So far, the stimulus for COVID is projected at $5.3 trillion!

Source: Peter G. Peterson Foundation
$787 billion versus $5.3 trillion – a huge difference!
The following table traces what has happened since 2008 along with what we know about the pandemic effects and projections thereof.

Source: IMF Data
And the stock markets: the S&P 500: after falling from 3,380 to 2,304 (31%) the S&P 500 recovered and added an additional 12% up to 3,971. 12% up means a gain of approximately $3.8 trillion.
A Sidebar – Paul Volcker
Paul Adolph Volcker Jr. was an American economist. He served two terms as the 12th Chair of the Federal Reserve under U.S. presidents Jimmy Carter and Ronald Reagan from August 1979 to August 1987. He saw the dangers of allowing banks to actively trade their deposits but did not have the political power to limit these trades. Since 2008, some trading has been allowed, but the capital levels that banks must maintain have been increased significantly. During those troubling times, he stood out against the banks that desperately wanted to trade in hopes of winning the “lottery”.
Looking Forward
With all that as background, what do we see happening this year? It is clear that the situation today is strikingly different than it was after the 2008 collapse. Unlike the huge losses suffered back then, savings have grown since the pandemic as people have had to stay at home. People have money to spend and it is reasonable to believe a major consumption jump will occur as the number of people vaccinated grows.
How will the Berkshire County economy emerge from the pandemic? As suggested above, the economic numbers are very positive. And now that Tanglewood has announced it will open, a very good year can be expected.
However, a few important caveats remain: government regulations will limit just how open the summer season can be and this will depend on the course of the pandemic. And at times, it appears to have a “a life of its own.”
We are now injecting 3 million people a day. If we continue at this rate, we will be able to continue at this rate, we will have the potential to inject All Americans (331 million) in less than 3 months.
