
Two charts that look interesting are the Daily charts of the Commodities ETF (DBC) and the AUD/USD forex pair.
Price on DBC is trading just above trendline support. It may be in the process of forming a Head & Shoulders pattern, with the 50 sma (red) at the neckline. The MACD, Stochastics, and RSI indicators are just above the zero or 50 level.
The AUD/USD is trading just below a confluence of trendline/price resistance and both the 50 and 200 smas, but just at its lower Bollinger Band. The MACD, Stochastics, and RSI indicators are all below the zero or 50 level and entering oversold territory.
If DBC breaks and holds below its neckline to indicate a measured move down to around 26.00, and if the AUD/USD continues to weaken to confirm such a scenario, we may see also equities weaken and decline.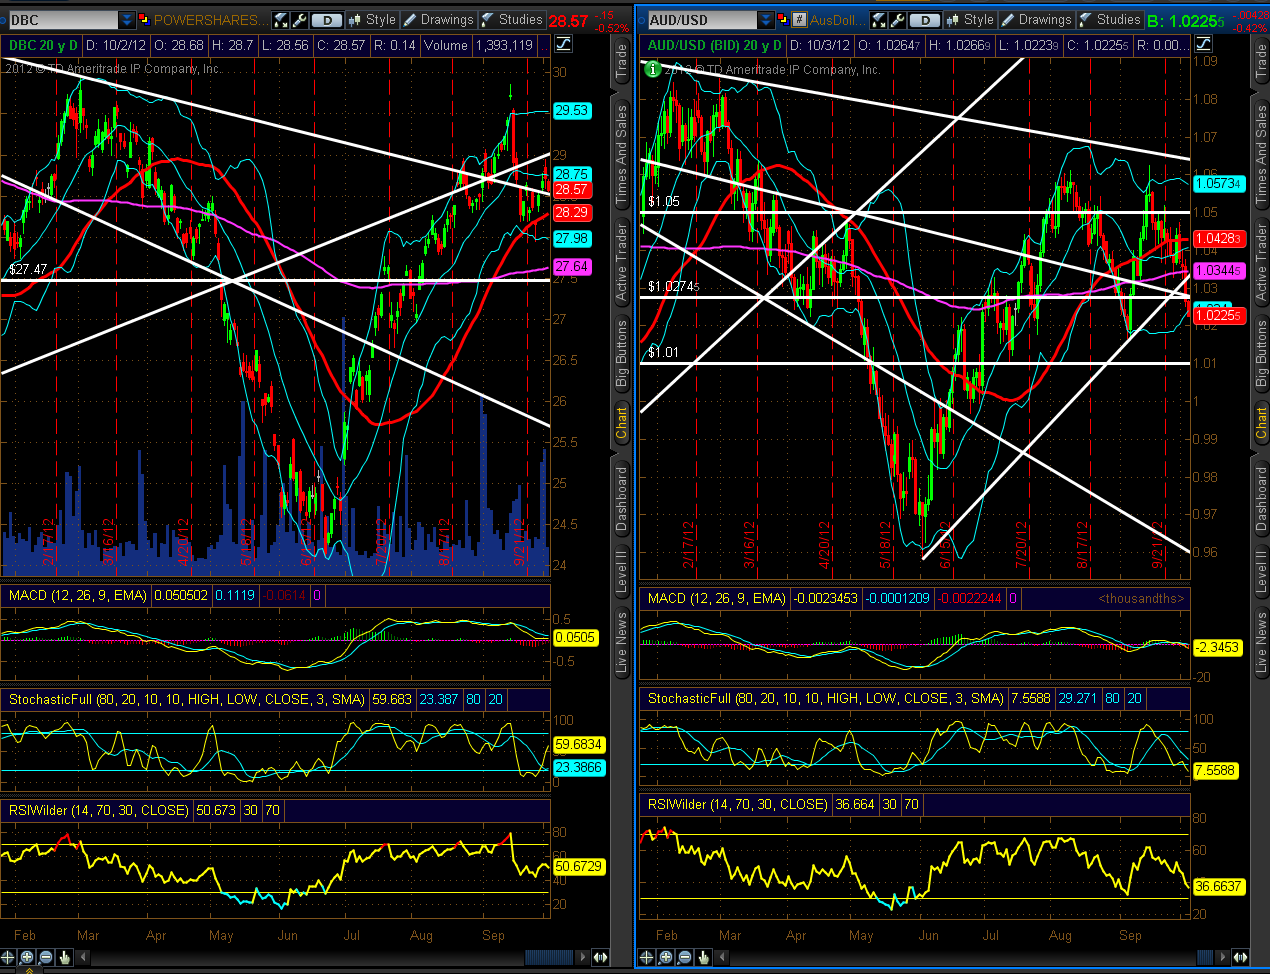 AUD/USD" title="AUD/USD" width="1270" height="974">
- English (UK)
- English (India)
- English (Canada)
- English (Australia)
- English (South Africa)
- English (Philippines)
- English (Nigeria)
- Deutsch
- Español (España)
- Español (México)
- Français
- Italiano
- Nederlands
- Português (Portugal)
- Polski
- Português (Brasil)
- Русский
- Türkçe
- العربية
- Ελληνικά
- Svenska
- Suomi
- עברית
- 日本語
- 한국어
- 简体中文
- 繁體中文
- Bahasa Indonesia
- Bahasa Melayu
- ไทย
- Tiếng Việt
- हिंदी
The Commodities Index And The AUD/USD Pair
Published 10/03/2012, 01:33 AM
Updated 07/09/2023, 06:31 AM
The Commodities Index And The AUD/USD Pair
Latest comments
Loading next article…
Install Our App
Risk Disclosure: Trading in financial instruments and/or cryptocurrencies involves high risks including the risk of losing some, or all, of your investment amount, and may not be suitable for all investors. Prices of cryptocurrencies are extremely volatile and may be affected by external factors such as financial, regulatory or political events. Trading on margin increases the financial risks.
Before deciding to trade in financial instrument or cryptocurrencies you should be fully informed of the risks and costs associated with trading the financial markets, carefully consider your investment objectives, level of experience, and risk appetite, and seek professional advice where needed.
Fusion Media would like to remind you that the data contained in this website is not necessarily real-time nor accurate. The data and prices on the website are not necessarily provided by any market or exchange, but may be provided by market makers, and so prices may not be accurate and may differ from the actual price at any given market, meaning prices are indicative and not appropriate for trading purposes. Fusion Media and any provider of the data contained in this website will not accept liability for any loss or damage as a result of your trading, or your reliance on the information contained within this website.
It is prohibited to use, store, reproduce, display, modify, transmit or distribute the data contained in this website without the explicit prior written permission of Fusion Media and/or the data provider. All intellectual property rights are reserved by the providers and/or the exchange providing the data contained in this website.
Fusion Media may be compensated by the advertisers that appear on the website, based on your interaction with the advertisements or advertisers.
© 2007-2024 - Fusion Media Limited. All Rights Reserved.