
High yielding dividend stocks are wonderful if you are looking for a fast cash payback. There are 417 high yield stocks traded on the capital markets, but not all have a sustainable dividend history and some are simply too expensive.
In order to find some attractive high yield stocks, I screened the popular S&P 500 by stocks with a dividend yield over 5 percent, as well as a low P/E ratio of less than 15. Turns out the index has 24 high yielders but only 10 companies have a low P/E ratio.
Below the results is one stock with a double digit yield; four stocks are recommend to buy:
Gannett (NYSE:GCI) has a market capitalization of $3.14 billion. The company employs 31,000 people, generates revenues of $5,239.99 million and has a net income of $500.13 million. The firm’s earnings before interest, taxes, depreciation and amortization (EBITDA) amounts to $1,012.42 million. Because of these figures, the EBITDA margin is 19.32 percent (operating margin 15.55 percent and the net profit margin finally 9.54 percent).
Financial Analysis: The total debt representing 26.61 percent of the company’s assets and the total debt in relation to the equity amounts to 75.62 percent. Due to the financial situation, a return on equity of 20.43 percent was realized. Twelve trailing months earnings per share reached a value of $1.80. Last fiscal year, the company paid $0.24 in form of dividends to shareholders.
Market Valuation: Here are the price ratios of the company: The P/E ratio is 7.41, P/S ratio 0.60 and P/B ratio 1.36. Dividend Yield: 5.98 percent. The beta ratio is 2.46. 
")
")
Exelon Corporation (NYSE:EXC) has a market capitalization of $25.47 billion. The company employs 19,267 people, generates revenues of $18,924.00 million and has a net income of $2,495.00 million. The firm’s earnings before interest, taxes, depreciation and amortization (EBITDA) amounts to $5,815.00 million. Because of these figures, the EBITDA margin is 30.73 percent (operating margin 23.67 percent and the net profit margin finally 13.18 percent).
Financial Analysis: The total debt representing 24.49 percent of the company’s assets and the total debt in relation to the equity amounts to 93.79 percent. Due to the financial situation, a return on equity of 17.86 percent was realized. Twelve trailing months earnings per share reached a value of $3.03. Last fiscal year, the company paid $2.10 in form of dividends to shareholders.
Market Valuation: Here are the price ratios of the company: The P/E ratio is 12.67, P/S ratio 1.73 and P/B ratio 1.77. Dividend Yield: 5.46 percent. The beta ratio is 0.53. 
")
")
ConocoPhillips (NYSE:COP) has a market capitalization of $66.16 billion. The company employs 29,700 people, generates revenues of $251,226.00 million and has a net income of $12,502.00 million. The firm’s earnings before interest, taxes, depreciation and amortization (EBITDA) amounts to $31,891.00 million. Because of these figures, the EBITDA margin is 12.69 percent (operating margin 9.16 percent and the net profit margin finally 4.98 percent).
Financial Analysis: The total debt representing 14.76 percent of the company’s assets and the total debt in relation to the equity amounts to 34.69 percent. Due to the financial situation, a return on equity of 18.59 percent was realized. Twelve trailing months earnings per share reached a value of $9.15. Last fiscal year, the company paid $2.64 in form of dividends to shareholders.
Market Valuation: Here are the price ratios of the company: The P/E ratio is 5.72, P/S ratio 0.26 and P/B ratio 1.04. Dividend Yield: 5.03 percent. The beta ratio is 1.12. 
")
")
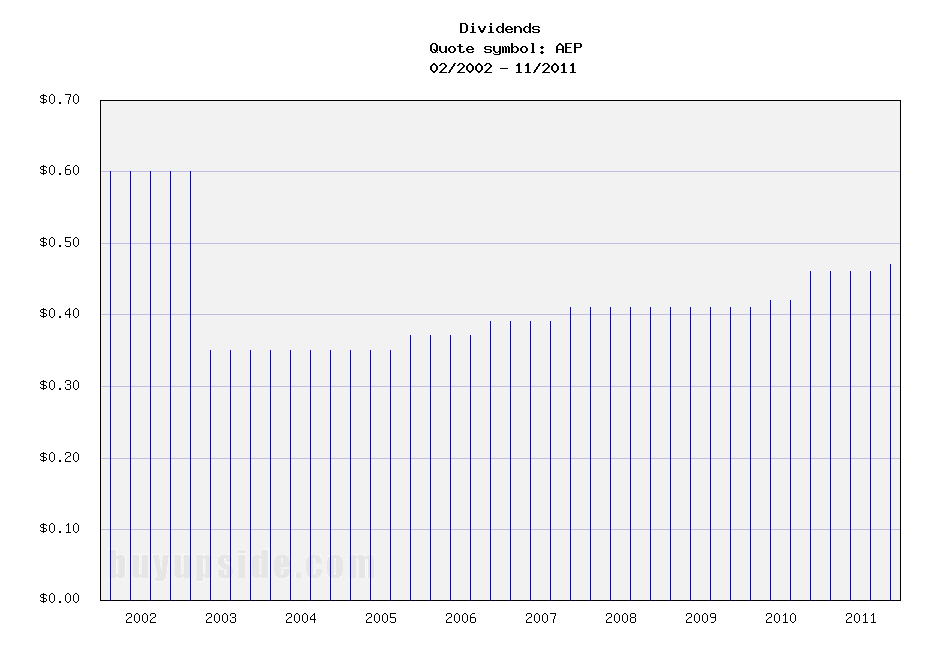
American Electric Power (NYSE:AEP) has a market capitalization of $18.21 billion. The company employs 18,710 people, generates revenues of $15,116.00 million and has a net income of $1,549.00 million. The firm’s earnings before interest, taxes, depreciation and amortization (EBITDA) amounts to $4,437.00 million. Because of these figures, the EBITDA margin is 29.35 percent (operating margin 18.40 percent and the net profit margin finally 10.25 percent).
Financial Analysis: The total debt representing 34.79 percent of the company’s assets and the total debt in relation to the equity amounts to 123.88 percent. Due to the financial situation, a return on equity of 11.09 percent was realized. Twelve trailing months earnings per share reached a value of $3.32. Last fiscal year, the company paid $1.85 in form of dividends to shareholders.
Market Valuation: Here are the price ratios of the company: The P/E ratio is 11.32, P/S ratio 1.21 and P/B ratio 1.24. Dividend Yield: 5.00 percent. The beta ratio is 0.50. 
")
Take a closer look at the full table of the cheapest S&P 500 high yield stocks. The average price to earnings ratio (P/E ratio) amounts to 10.49 and forward P/E ratio is 10.19. The dividend yield has a value of 5.88 percent. Price to book ratio is 4.93 and price to sales ratio 5.88. The operating margin amounts to 16.28 percent.
Here is the full table with some fundamentals (TTM):
Related stock ticker symbols:
PBI, GCI, EXC, HRB, PPL, CVC, ETR, COP, TE, AEP
- English (UK)
- English (India)
- English (Canada)
- English (Australia)
- English (South Africa)
- English (Philippines)
- English (Nigeria)
- Deutsch
- Español (España)
- Español (México)
- Français
- Italiano
- Nederlands
- Português (Portugal)
- Polski
- Português (Brasil)
- Русский
- Türkçe
- العربية
- Ελληνικά
- Svenska
- Suomi
- עברית
- 日本語
- 한국어
- 简体中文
- 繁體中文
- Bahasa Indonesia
- Bahasa Melayu
- ไทย
- Tiếng Việt
- हिंदी
The Cheapest High-Yield Stocks Within The S&P 500
Published 05/17/2012, 04:07 AM
Updated 07/09/2023, 06:31 AM
The Cheapest High-Yield Stocks Within The S&P 500
3rd party Ad. Not an offer or recommendation by Investing.com. See disclosure here or
remove ads
.
Latest comments
Install Our App
Risk Disclosure: Trading in financial instruments and/or cryptocurrencies involves high risks including the risk of losing some, or all, of your investment amount, and may not be suitable for all investors. Prices of cryptocurrencies are extremely volatile and may be affected by external factors such as financial, regulatory or political events. Trading on margin increases the financial risks.
Before deciding to trade in financial instrument or cryptocurrencies you should be fully informed of the risks and costs associated with trading the financial markets, carefully consider your investment objectives, level of experience, and risk appetite, and seek professional advice where needed.
Fusion Media would like to remind you that the data contained in this website is not necessarily real-time nor accurate. The data and prices on the website are not necessarily provided by any market or exchange, but may be provided by market makers, and so prices may not be accurate and may differ from the actual price at any given market, meaning prices are indicative and not appropriate for trading purposes. Fusion Media and any provider of the data contained in this website will not accept liability for any loss or damage as a result of your trading, or your reliance on the information contained within this website.
It is prohibited to use, store, reproduce, display, modify, transmit or distribute the data contained in this website without the explicit prior written permission of Fusion Media and/or the data provider. All intellectual property rights are reserved by the providers and/or the exchange providing the data contained in this website.
Fusion Media may be compensated by the advertisers that appear on the website, based on your interaction with the advertisements or advertisers.
© 2007-2024 - Fusion Media Limited. All Rights Reserved.