AT40 = 31.2% of stocks are trading above their respective 40-day moving averages (DMAs)
AT200 = 48.0% of stocks are trading above their respective 200DMAs
VIX = 18.6 (17.7% gain)
Short-term Trading Call: bullish (caveats below!)
Commentary
During the thick of the sell-off earlier this month, I stated with tongue-in-cheek that Federal Reserve Chair Jerome Powell’s first order of business would be to reassure markets that interest rates would increase so slowly markets would not notice. Powell failed to deliver in his testimony to Congress. Apparently, in response to a question about what it would take to go from 3 to 4 rate hikes this year, Powell suggested/implied that he was open to 4 given the amount of fiscal stimulus pouring into the economy. It was like an easy pitch designed to get markets riled up. That news got the robots and algorithms dumping stocks overboard with a quickness. The end result was a collection of bearish engulfing patterns on the major indices that gummed up the engine of the market’s steamroller.
A bearish engulfing pattern most distinctly occurs when a stock or index opens higher than the previous day’s intraday high and then closes below the previous day’s intraday low. The pattern is most ominous when a string of buying precedes it; think of a steamroller running out of gas and coming to a halt. The ETFs for the major indices satisfied the criteria by a tiny fraction of a point on the upside. The NASDAQ and the S&P 500 barely missed but are “close enough.”
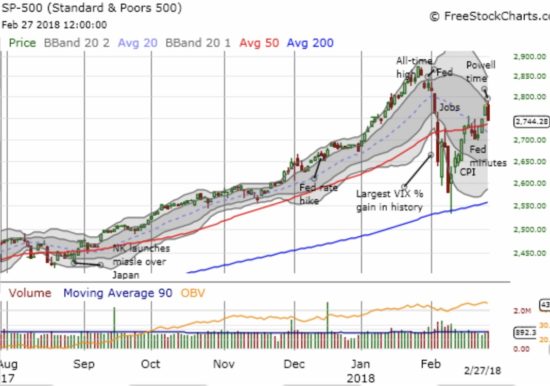
It was Jerome Powell’s day to shine, but the market looked as closely as it could for an excuse to sell off in response to his Congressional testimony. The S&P 500 (via SPDR S&P 500 (NYSE:SPY)) lost 1.3% and stopped just short of a test of 50DMA support.
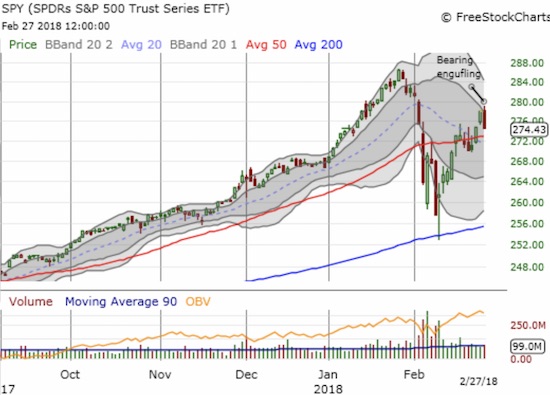
The bearish engulfing pattern on the SPDR S&P 500 ETF (NYSE:SPY) is a little more clear with the slightly higher open and then a long red bar to close lower than the previous day’s intraday low.
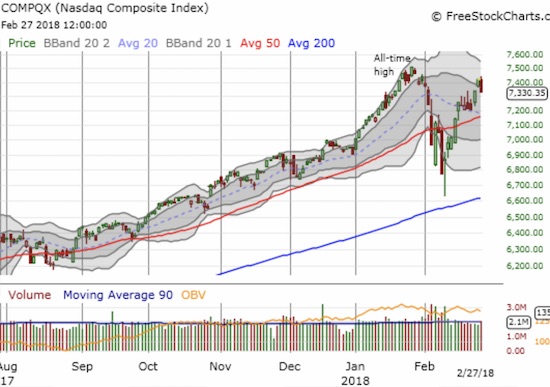
The NASDAQ opened slightly lower and closed with a 1.2% loss. With the 20 and 50DMAs converging, a test of support seems almost inevitable.
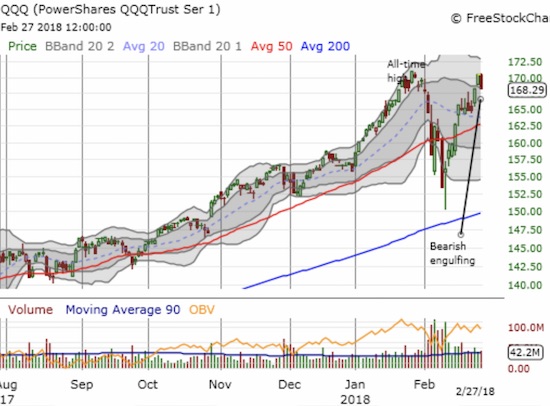
Like SPY, the PowerShares QQQ ETF (NASDAQ:QQQ) formed a bearish engulfing pattern on its way to a 1.2% loss. The tech-laden index stopped just short of its all-time high.
The irony of these bearish patterns is that to start the week the S&P 500 confirmed its breakout above its 50-day moving average (DMA). Now the index is already threatening to put that new support to a critical test. As I laid out earlier, I was waiting for a confirmation before flipping my trading call from neutral to bullish. Now I am leaving the trading call at bullish and looking for the confirmation of a successful test of 50DMA support. However, I think the NASDAQ and QQQ will soon test their 50DMA supports. Given the distance they have to travel, it is hard to imagine that S&P 500 will hold its support during the time it takes for tech to descend. This dynamic complicates my trading call, so I will likely await the test of the tech-laden indices before making a decision to flip the short-term trading call yet again.
AT40 (T2108), the percentage of stocks trading above their respective 40DMAs, further complicates a potential change in the trading call. AT40 dropped almost 9 percentage points to close at 31.2%. This level is “close enough” to oversold (below 20%) to dissuade me from getting bearish. At this level I like to prepare to get aggressively bullish.
In other words, while I could switch back to neutral, it will take a LOT to make me switch to bearish…like a breakdown below February’s lows and a close below 200DMAs.
The volatility index, the VIX, put an exclamation mark on the selling. The fear gauge made a picture perfect bounce off the surprisingly important 15.35 pivot. The VIX soared 17.7% to close at 18.6. While I did not enjoy discovering my profits on my short iPath S&P 500 VIX ST Futures ETN (NYSE:VXX) had disappeared, I am keeping my eyes fixed on an eventual breakdown of the VIX below the 15.35 pivot. My VIX strategy might change if, for example, the S&P 500 breaks down below 50MDA support. Such an event seems like a good time to watch out for the next sudden spike in volatility.
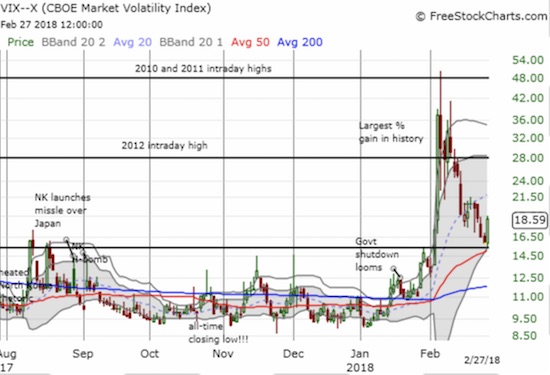
The volatility index, the VIX, pulled off an Olympic-style jump off the 15.35 pivot – you just can’t make this stuff up!
With my short-term trading call set on bullish, I bought the dip in the S&P 500 by adding call options to an existing calendar spread. I did not get a chance to profit from another Monday rally from Apple (NASDAQ:AAPL), but I positioned for next week by buying a calendar spread at the $180 strike and selling short this week’s expiration versus buying next week’s expiration. AAPL traded to a new intraday all-time high at $180.48, but faded to a close at $178.39 – itd 5th highest close ever.
CHART REVIEWS
iShares US Home Construction ETF (NYSE:ITB)
Home builders are flashing one of the bigger warning signs around. With the major indices potentially grinding to a halt, ITB will not get the tailwinds it so desperately needs to prevent a very bearish breakdown below its 200DMA. The downtrending 20DMA has capped ITB since the sell-off, and today’s pullback in sympathy with a poor response to Toll Brothers (NYSE:TOL) earnings confirmed that resistance. I am bracing myself for a 200DMA test, and the effective end to seasonal trade on home builders. I will cover more of my thoughts in the next Housing Market Review.
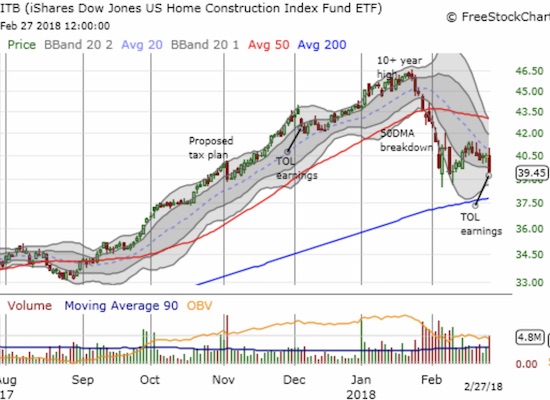
The iShares US Home Construction ETF (ITB) has significantly lagged the market’s rebound. Tuesday's 2.5% loss brought ITB right back to its closing low of the month.
Macy’s (NYSE:M)
The strong post-earnings response to Macy’s delivered a glimmer of hope that retail stocks could still be top plays of 2018. A fade from the highs tainted the promise (gap and crap), but the close managed to hold the breakout to an 11-month high. At the intraday high Macy’s was up 13.1% and filled the big May, 2017 earnings gap down. For a fundamental case to keep buying Macy’s see Jim Cramer in “‘Miracle worker’ Jeff Gennette will make Macy’s turnaround sustainable.” Also note that stubborn bears are still short 23.2% of float. Of course, that is peanuts compared to department store Dillard’s (DDS) which has 48.3% of its float sold short. DDS gapped up after earnings and held a 16.9% gain.
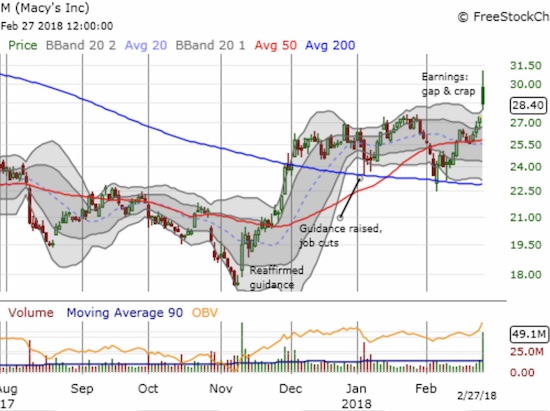
Macy’s (M) is up 63% from the November low. Can the stock hold onto its bullish breakout despite the crap after the gap up?
Currency Markets
The currency markets are starting to flash the potential for significant changes. The euro looks like it is topping against the U.S. dollar. If EUR/USD follows through on its 50DMA breakdown by zipping past February’s low, I will have to assume a top for EUR/USD and a bottom for the U.S. dollar in general. The next question is whether dollar strength in of itself will cause additional market angst. I am on high alert on this one.
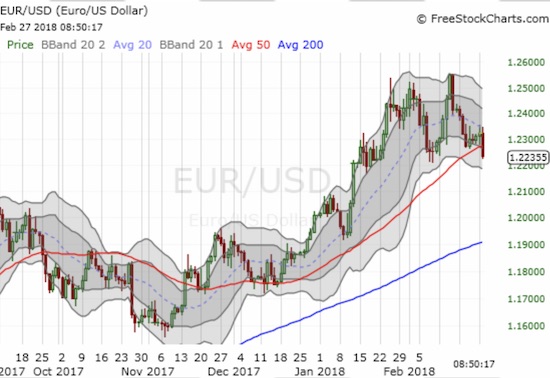
Is that the sound of the euro topping? EUR/USD broke through 50DMA support, and it is just a hair away from making a lower low.
One of my favorite sentiment indicators, the Australian dollar (NYSE:FXA) versus the Japanese yen (NYSE:FXY), never recovered much while stocks were soaring off lows. Now AUD/JPY is omniously scratching at its February lows again…
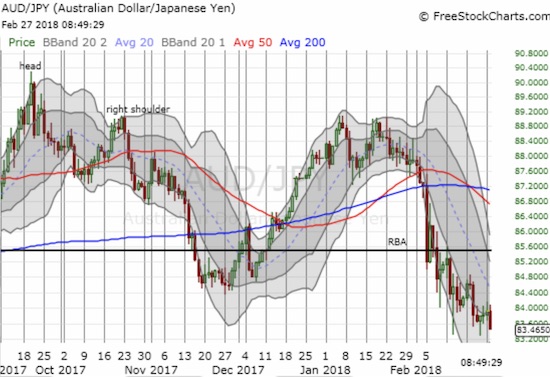
AUD/JPY is reaching for a double confirmation of the head and shoulders top last year. AUD/JPY sits near an 8-month low.
Trades related to previous posts: None
— – —
“Above the 40” uses the percentage of stocks trading above their respective 40-day moving averages (DMAs) to assess the technical health of the stock market and to identify extremes in market sentiment that are likely to reverse. Abbreviated as AT40, Above the 40 is an alternative label for “T2108” which was created by Worden. Learn more about T2108 on my T2108 Resource Page. AT200, or T2107, measures the percentage of stocks trading above their respective 200DMAs.
Active AT40 (T2108) periods: Day #8 over 20%, Day #3 over 30% (overperiod), Day #15 under 40%, Day #15 under 50%, Day #16 under 60%, Day #22 under 70%
Daily AT40 (T2108)
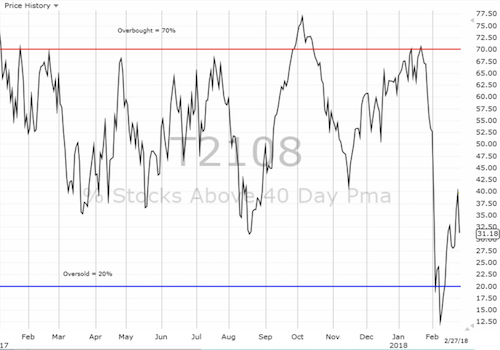
Black line: AT40 (T2108) (% measured on the right)
Red line: Overbought threshold (70%); Blue line: Oversold threshold (20%)
Weekly AT40 (T2108)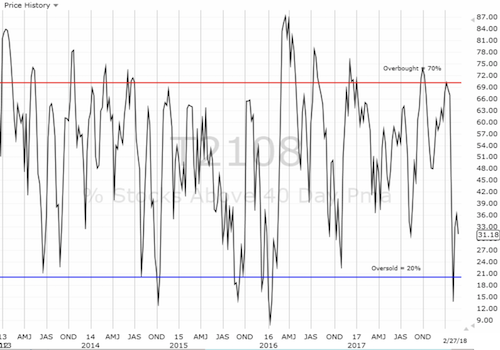
Be careful out there!
Full disclosure: short VXX, long SPY call spread, long EUR/USD, long and short various currency pairs on the U.S. dollar, long the Japanese yen.
