Regular readers know that I have been bullish for the past few weeks. Michele of The Night Owl Trader agreed in a comment from a past blog post:
I agree. I voted bullish on the poll this week too. It may be unsettling to see people throwing Molotov cocktails in Madrid, but looking at the weekly and monthly SPX charts I'm just not seeing any topping action there despite the recent pullback.
Utilizing Weekly Charts
I have generally used daily charts, but her comment about using weekly charts reminded me that they can be a useful perspective for investors who are less interested in the daily ups and downs of the market. A review of the weekly charts show an equity market that remains in bullish mode, though the bulls face a crucial test in the week ahead.
Here is the SPX. The uptrend remains intact, though the index is testing the uptrend line.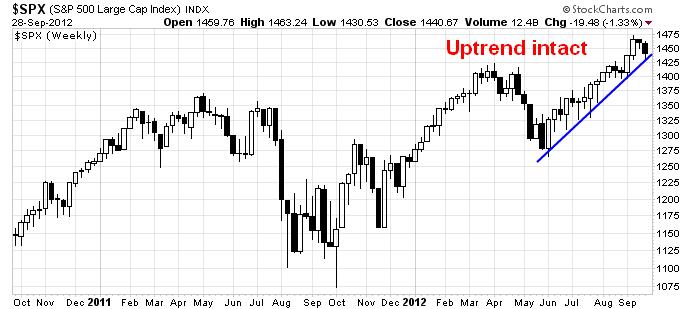
The small cap Russell 2000 presents a similar picture. However, while the large caps have pushed through to new highs, small-cap stocks are caught between an ascending trend line and overhead resistance as it tries to rally above the 2011 highs.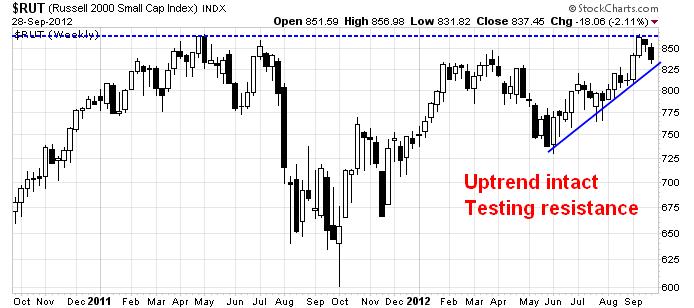
What about Europe, which was the source of much angst last week? The Euro STOXX 50 remains in an uptrend as well and is in the familiar position of testing that uptrend line as are U.S. equity averages. 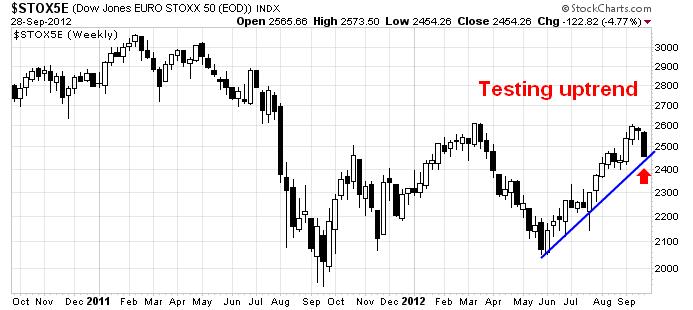
When I consider market internals, I see a similar picture. The relative returns of the Morgan Stanley Cyclical Index (CYC) against the market shows that it rallied through a relative downtrend line in August and it has begun an uptrend. While CYC has pulled back on a relative basis, the relative uptrend remains intact.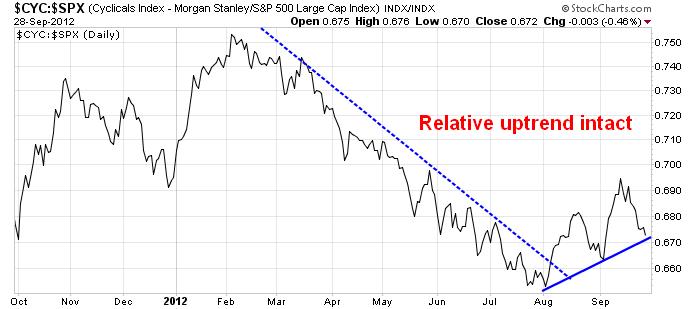
Measures of risk appetite tell the same story. Here is the silver-gold ratio. Silver is the more speculative of the precious metals and tends to outperform gold on the upside. This ratio is now consolidating its gains and show no sign of a relative breakdown, indicating that risk appetite is not in retreat.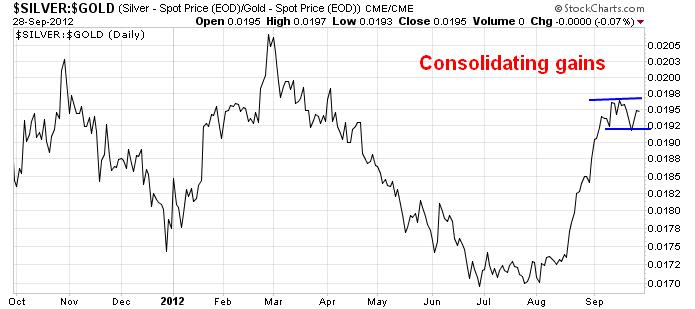
Here in Canada, I watch the ratio of the smaller speculative TSX Venture Index against the more senior TSX Index. Risk appetite remains alive and well here in the Great White North.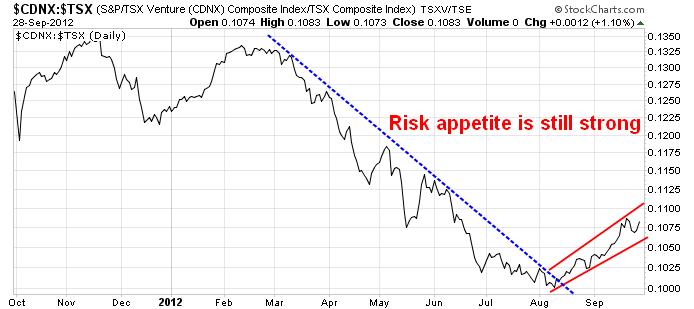
To summarize, these charts show a picture of a test of a bullish uptrend and I am inclined to give the bulls the benefit of the doubt. However, should the market averages either decline or move sideways, I would have to re-evaluate my bullish views.
What Could Go Right?
In reviewing the weeks ahead, the headlines are full of stories of what could go wrong. I also think about what could go right. First, there are reports from two German magazines that Greece will get the next tranche of aid despite the slow progress towards on reforms.
As well, Asian economic releases reported overnight told a story of improvement. South Korea's September exports fell by -1.8%, compared to consensus expectations of -5.5%. China's September PMI rose to 49.8 from 49.2 in August, though it fell short of expectations of 50.1. As I write these words, stocks were down in Tokyo but other Asian markets were up.
Despite the general weakness in the Asian and European economies, an important reason to be bullish are the signs of an improving American economy. New deal democrat over at Bonddad blog summarized last week this way:
Almost all of the high frequency data this week was positive, much of it strongly so. Only the three transportation-related metrics were negative: rail traffic, shipping rates, and gasoline usage. All of these suggest considerable coincident weakness in the economy. But the positives were legion: gas prices declined, credit spreads narrowed, corporate bond prices increased, money supply remains strongly positive, overnight rates have sunk into a deep sleep, the recovery in housing continues, employment tax withholding has rebounded, temporary staffing has bounced, and the US consumer continues to spend like a champ! These positives suggest that the coincident weakness will pass rather than deepen. As always, energy prices are a wild card and bear close watching.
Watching Friday's Nonfarm Payrolls
We have the all important (though noisy) Nonfarm Payroll figure due this Friday. Gallup does a tracking poll and I interpret the results to mean that NFP will either be in line with expectations or beat. 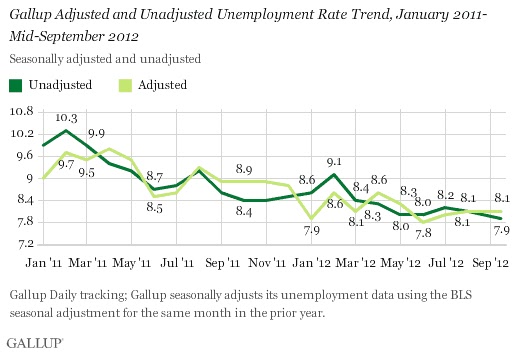
Gallup's poll indicated that the raw unadjusted unemployment rate is expected to tick down but the seasonally adjusted rate to be flat. However, the number of part-time workers looking for full time work is declining, which suggests that under-employment picture is improving.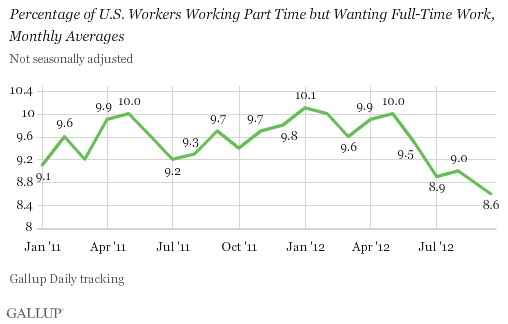
Another reason to be bullish is initial jobless claims data has also been improving. Joe Weisenthal found an excellent correlation between initial claims and the stock market.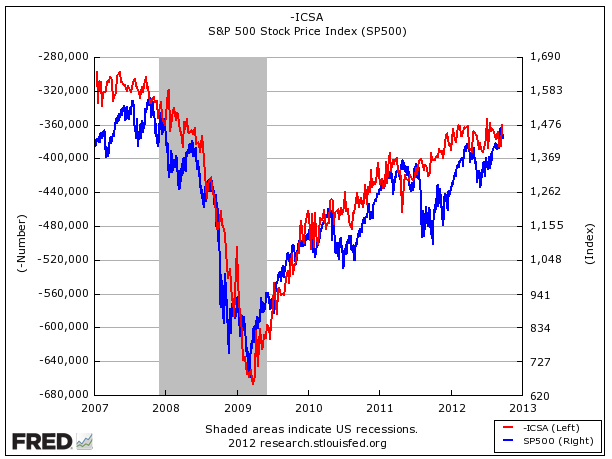
Consumer confidence is also improving. The Conference Board reported that consumer confidence surged nine points in September and beating expectations. As we approach Earnings Season, that should be a measure of good news for equities.
Cam Hui is a portfolio manager at Qwest Investment Fund Management Ltd. ("Qwest"). This article is prepared by Mr. Hui as an outside business activity. As such, Qwest does not review or approve materials presented herein. The opinions and any recommendations expressed in this blog are those of the author and do not reflect the opinions or recommendations of Qwest.
None of the information or opinions expressed in this blog constitutes a solicitation for the purchase or sale of any security or other instrument. Nothing in this article constitutes investment advice and any recommendations that may be contained herein have not been based upon a consideration of the investment objectives, financial situation or particular needs of any specific recipient. Any purchase or sale activity in any securities or other instrument should be based upon your own analysis and conclusions. Past performance is not indicative of future results. Either Qwest or Mr. Hui may hold or control long or short positions in the securities or instruments mentioned.
- English (UK)
- English (India)
- English (Canada)
- English (Australia)
- English (South Africa)
- English (Philippines)
- English (Nigeria)
- Deutsch
- Español (España)
- Español (México)
- Français
- Italiano
- Nederlands
- Português (Portugal)
- Polski
- Português (Brasil)
- Русский
- Türkçe
- العربية
- Ελληνικά
- Svenska
- Suomi
- עברית
- 日本語
- 한국어
- 简体中文
- 繁體中文
- Bahasa Indonesia
- Bahasa Melayu
- ไทย
- Tiếng Việt
- हिंदी
The Bull Case Remains Intact
Published 10/01/2012, 11:00 AM
Updated 07/09/2023, 06:31 AM
The Bull Case Remains Intact
Latest comments
Loading next article…
Install Our App
Risk Disclosure: Trading in financial instruments and/or cryptocurrencies involves high risks including the risk of losing some, or all, of your investment amount, and may not be suitable for all investors. Prices of cryptocurrencies are extremely volatile and may be affected by external factors such as financial, regulatory or political events. Trading on margin increases the financial risks.
Before deciding to trade in financial instrument or cryptocurrencies you should be fully informed of the risks and costs associated with trading the financial markets, carefully consider your investment objectives, level of experience, and risk appetite, and seek professional advice where needed.
Fusion Media would like to remind you that the data contained in this website is not necessarily real-time nor accurate. The data and prices on the website are not necessarily provided by any market or exchange, but may be provided by market makers, and so prices may not be accurate and may differ from the actual price at any given market, meaning prices are indicative and not appropriate for trading purposes. Fusion Media and any provider of the data contained in this website will not accept liability for any loss or damage as a result of your trading, or your reliance on the information contained within this website.
It is prohibited to use, store, reproduce, display, modify, transmit or distribute the data contained in this website without the explicit prior written permission of Fusion Media and/or the data provider. All intellectual property rights are reserved by the providers and/or the exchange providing the data contained in this website.
Fusion Media may be compensated by the advertisers that appear on the website, based on your interaction with the advertisements or advertisers.
© 2007-2024 - Fusion Media Limited. All Rights Reserved.
