Have you noticed the absolute carnage taking place in the U.S. shale oil stocks? It seems as if Wall Street and investors are finally starting to grow weary of an industry that hasn’t made money in the past decade. Unfortunately, it took a longer than I expected, but the shale stocks have significantly underperformed against the major oil companies. Now, when I say, “underperformed,” wait until you see the numbers.
Of course, the bloodbath taking place in U.S. shale stocks shouldn’t be a surprise as the WARNING SIGNS have been many. For example, this article back in February, Wall Street Loses Faith In Shale, stated the following:
To Wall Street, the shale industry has lost a lot of its allure. A decade’s worth of promises have failed to materialize, and Big Finance is cutting some of its ties with smaller shale drillers who have not delivered.
The Wall Street Journal reports that the shale industry only saw $22 billion in new bond and equity deals, down by more than half from 2016 levels, which was a much worse time for the market.
The steep decline in new debt and equity issuance is a sign that major investors are no longer rushing to finance unprofitable shale drilling. It’s worth noting that this is a new development. For years Wall Street financed unprofitable drilling, holding out on the promise that rapid production growth would eventually pay off.
So, it seems as if investors are no longer willing to finance the U.S. Shale Oil Industry Black Hole. And why should they? One of the largest shale players in the Permian, Pioneer Resources, suffered its eighth consecutive year of negative free cash flow. In 2018, Pioneer spent $541 million more on capital expenditures than it made from cash from operations and if we add up all the eight years, it’s a grand total of $6.8 billion in negative free cash flow.
As the shale companies continue to spend more than they make, the major oil companies have reported significant increases in positive free cash flow over the past several years. Chevron (NYSE:CVX) reported nearly $24 billion in positive free cash flow for 2017-2018, while ExxonMobil (NYSE:XOM) enjoyed more than $31 billion during the same period.
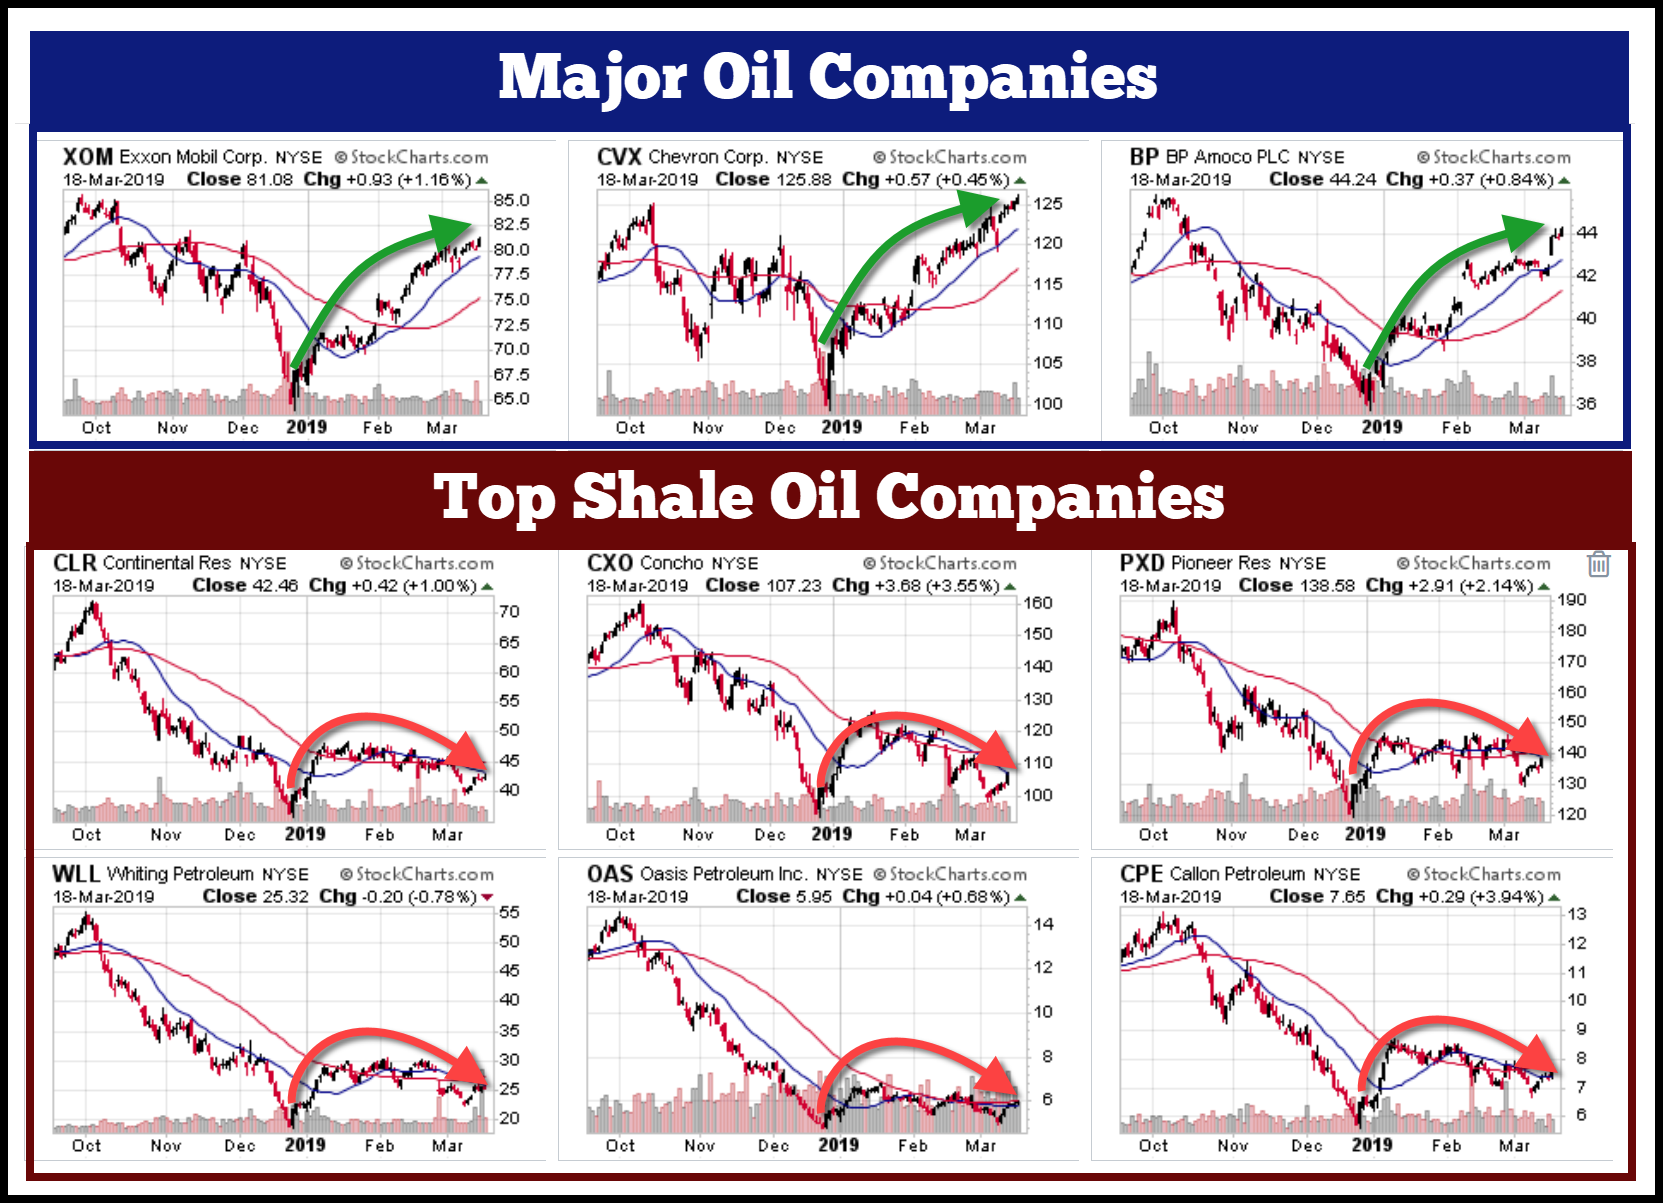
If we compare the stock price performance of the major oil companies versus shale, we can spot a troubling sign:

The major oil companies’ stock prices have all increased significantly off their lows, while their shale counterparts have experienced a downward trend. ExxonMobil, Chevron, and BP (LON:BP) are heading back to their highs in October as Continental Resources (NYSE:CLR), Concho Resources (NYSE:CXO), Pioneer Natural Resources Company (NYSE:PXD), Whiting Petroleum Corporation (NYSE:WLL), Oasis Petroleum Inc (NYSE:OAS), and Callon Petroleum Company (NYSE:CPE) are all down considerably.
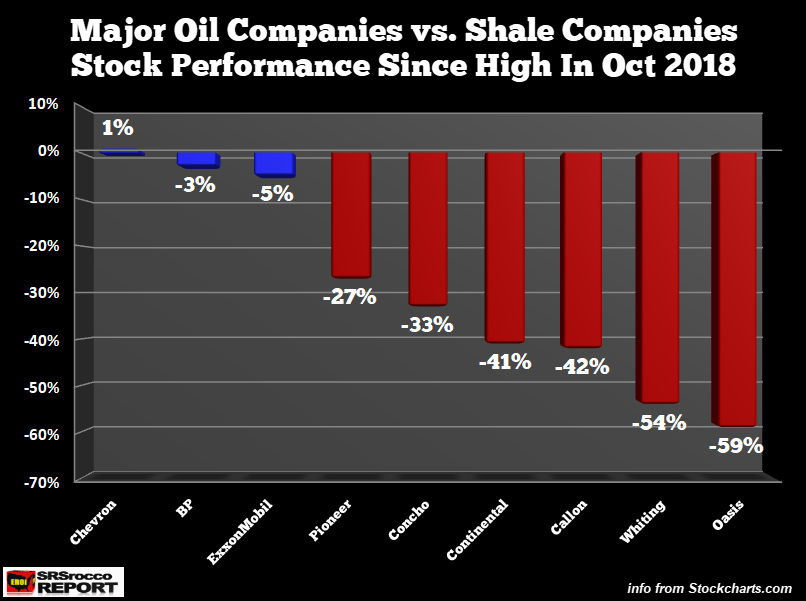
Here is the percentage difference between these oil companies since the high back in October:

Chevron is higher by almost 1% since its peak back in October, while BP is down 3% and ExxonMobil off by 5%. However, we can see that the shale companies (in RED) are down between 27-59%. If we take an average for both groups, the major oil companies are down 2% from their highs in October while the shale companies are lower by a staggering 43%.
Numbers don’t lie.
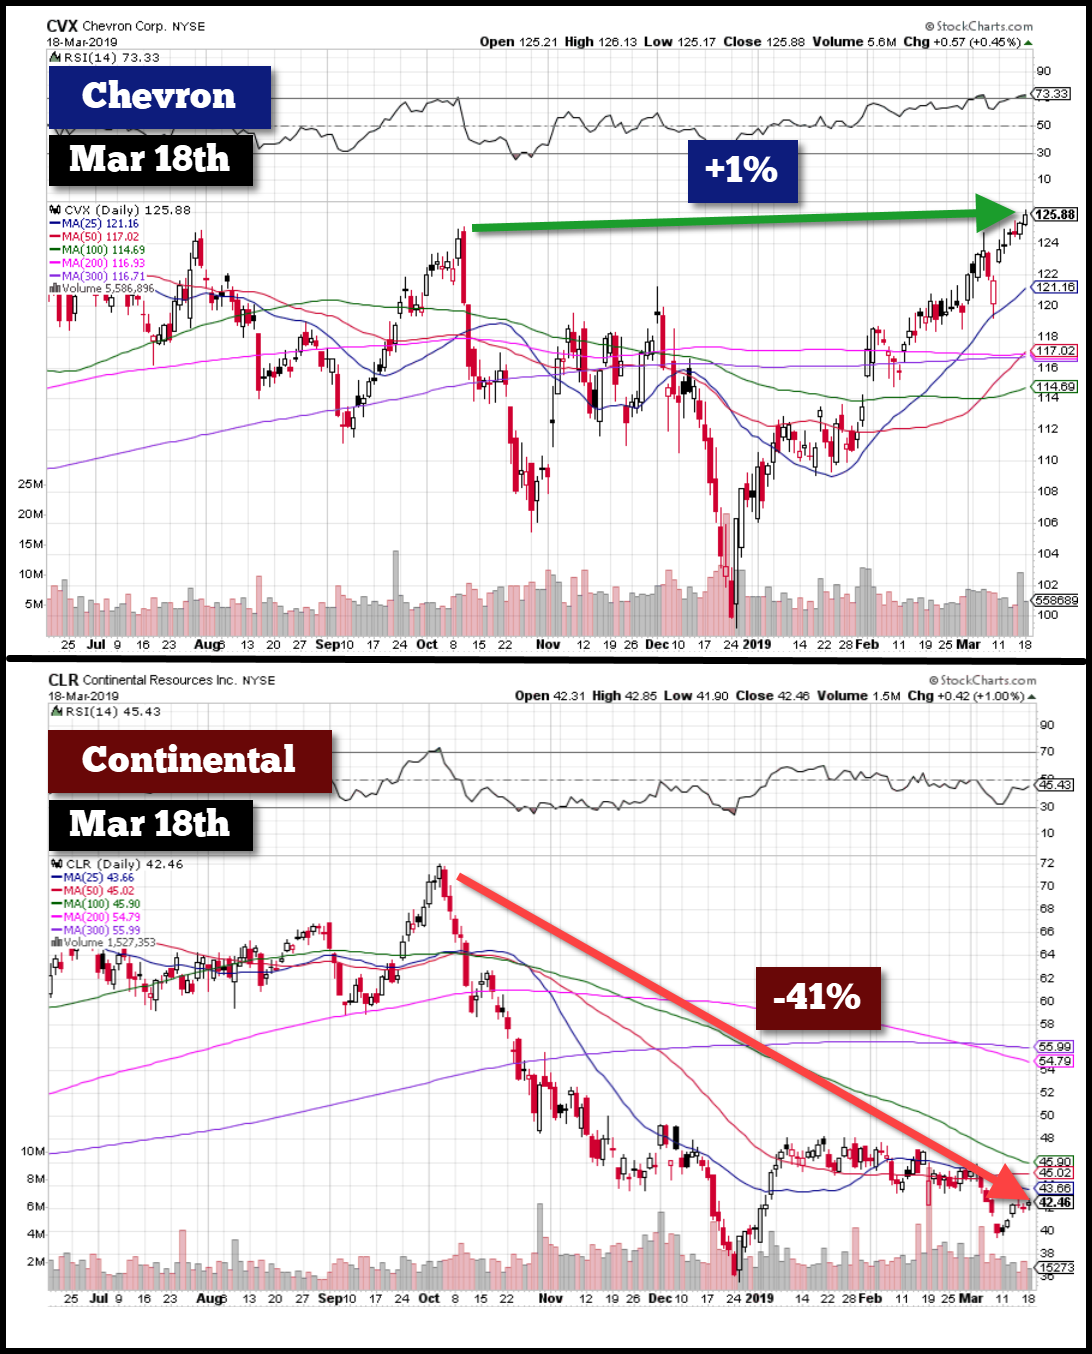
Even though the nine small stock charts above give us a pretty good indication of the disaster taking place in the shale industry, these two charts provide a better close-up view:

While Chevron was basically flat since its high in October, Continental Resources is down a whopping 41%. And if you look closely, you will notice that the majority of the divergence took place at the beginning of February as Chevron continued to trade higher, Continental remained flat than fell lower in March.
Unfortunately, I believe the worst is yet to come for the shale companies because once the markets finally start to correct lower, their share prices are currently at a much lower level than the majors. As I mentioned, the majors are nearly back to their October highs, while the average shale company is down 43%.
While I would be nervous wreck holding any shale oil company stock, those with much higher the share prices, Pioneer and Concho, have much farther to fall. Thus, those who are wise and decide to place shorts or purchase puts on these companies will likely be handsomely rewarded as the U.S. Shale Oil Ponzi collapses.
IMPORTANT NOTE: This information is only for educational purposes. Do not make any investment decisions based on the information in this article. Do you own due diligence.
