For the record, the VIX Index measures the implied volatility of options on ticker S&P 500. In theory, when investors are fearful they will bid up option in order to protect themselves. This inflates the amount of time premium built into option price and this is reflected in the form of higher implied volatility.
When investors become complacent, time premium tends to wane and implied volatility levels fall.
If none of that makes the least bit of sense to you DO NOT STOP READING. For while this information is technically correct it has nothing to do with the strategy I will show you in a moment.
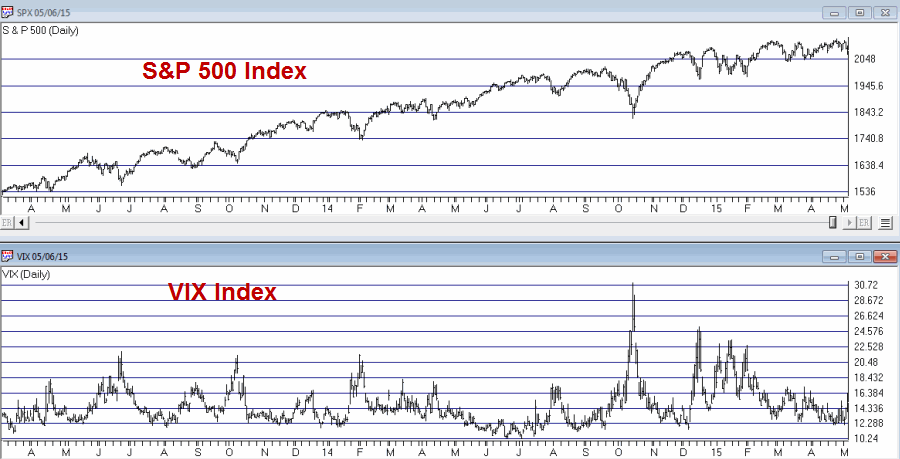
Just to illustrate the points above, Figure 1 displays the VIX index on the bottom and the S&P 500 on the top. The key thing to note is that when the SPX falls hard, VIX almost invariably “spikes” and vice versa.
Figure 1 – SPX and VIX Index (Courtesy: AIQ TradingExpert)
Eventually the marketing people decided to create futures contracts to track the VIX Index and then other marketing people got the bright idea to create an ETF that would hold VIX futures contracts and purportedly track the VIX Index and allow people to trade volatility. And so it came to pass when ticker (ARCA:VXX) opened for trading.
And all went well. Right up until the first time the ETF had to roll out of one expiring futures contract month and into another. You see there is this thing that someone (clearly not a marketing person) decided to call “contango”. But in a nutshell, the further out futures contracts trade at a higher price than the nearer term futures contract and the ETF “rolling” out of one into the other has to pay up to get into the next futures contract.
A simple analogy to help you understand the effect of contango on an ETF that trades futures contracts:
*“Contango” is to ticker VXX as “Iceberg” is to Titanic
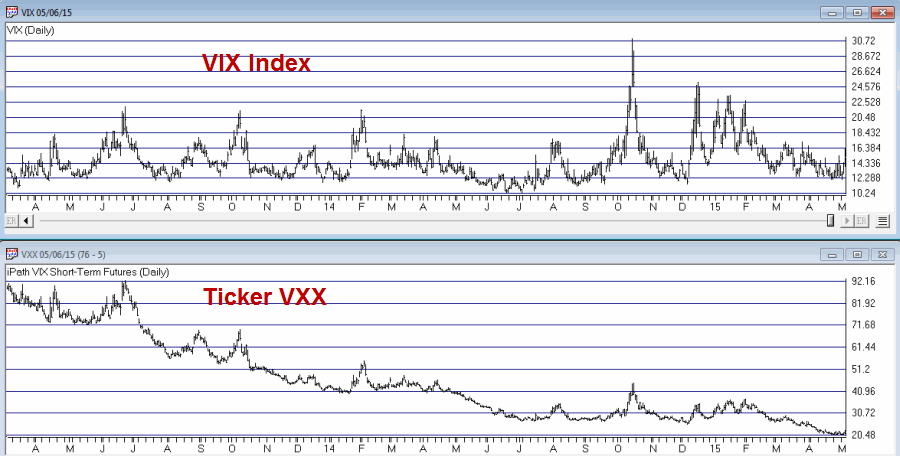
To illustrate this point, Figure 2 displays the actual VIX Index itself on top and ticker VXX on the bottom.
Figure 2 – VIX Index and ticker VXX (Courtesy: AIQ TradingExpert)
Inverse Volality ETF
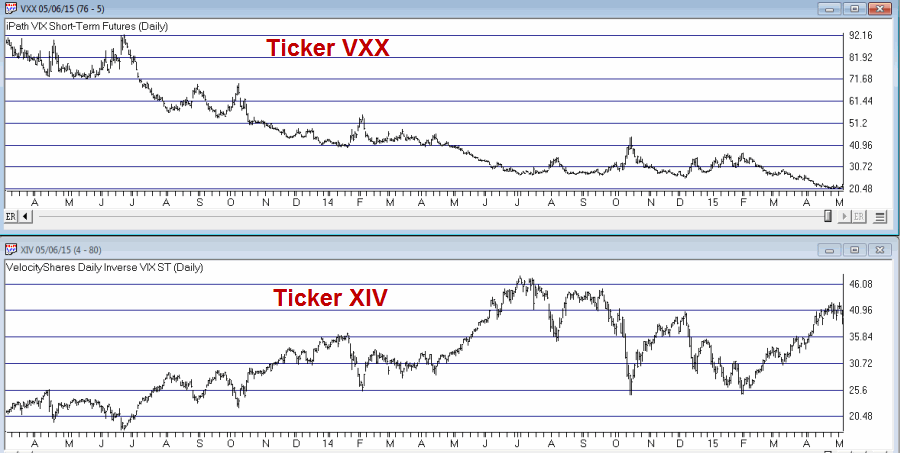
After everyone piled onto his great new thing (VXX/Titanic) some other marketing person realized that people who are willing to trade “volatility” are, well, kind of volatile by nature. So at some point they were going to want to play the other side of the market so an “Inverse” volatility ETF was created. This is ticker VelocityShares Daily Inverse VIX Short Term linked To SP 500 VIX Short Fut Exp 4 Dec 2030 (NASDAQ:XIV) and it is designed to trade inversely to the VIX Index. Figure 3 displays ticker VXX on the top and ticker XIV on the bottom.
Figure 3 – Ticker VXX and ticker XIV (Courtesy: AIQ TradingExpert)
A Trading Strategy (Maybe?)
Before I pass along the details please note that I do not trade this particular strategy and I am not recommending that you do either. But the bottom line is that the results are so compelling that:
1) It certainly merits at least some consideration from traders who are OK with doing this sort of trade.
2) Still leaves me muttering things like “it looks too good to be true” and “what the catch?”
Many traders will buy VXX if they think volatility is about to move higher and will buy XIV if they think volatility is about to move lower. Which makes sense. But these traders apparently didn’t quite get the whole thing about the iceberg/contango.
So just for fun, consider this strategy:
1) Sell short both ticker VXX and ticker XIV
2) Rebalance at the end of each year so that 50% of the portfolio is short VXX and 50% is short XIV.
3) Hold these positions until you have enough money to retire.
OK, Step #1 involves having your broker find enough shares of both ETFs to sell short, and requires you to establish and maintain whatever margin requirements your broker, um, requires in order to maintain these positions.
Step #2 is just good business practice so that neither position holds too much wait.
Step #3 is the part where I start muttering “it looks too good to be true” and “what the catch?”
Results
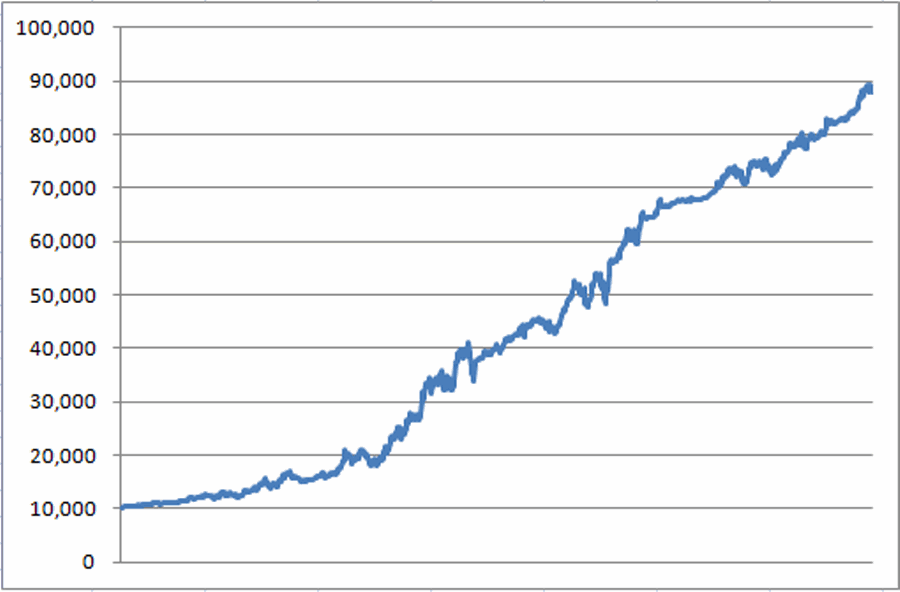
Remembering that this is a hypothetical exercise, the results depicted in Figure 4 display the results of shorting $5,000 worth of both VXX and VIX on 11/30/2010 (when ticker XIV started trading).
Figure 4 – Growth of $10,000 short both VXX and XIV (annual rebalancing); 10/11/30 through 5/6/15
OK, so you get my drift about “looking to good to be true”, right?
Summary
Repeating now: I have not personally entered into this position nor am I urging or even recommending that you do.
But something about it sure is interesting, no?


