Review And Update
On Thursday and Friday, the markets mustered a “Pre-G20 rally” in anticipation of a positive outcome from the meeting between President Trump and Xi. I will discuss the outcome of this meeting in just a moment.
The good news is that June was one of the best performing months for the Dow Jones Industrial Average over the past 80-years.
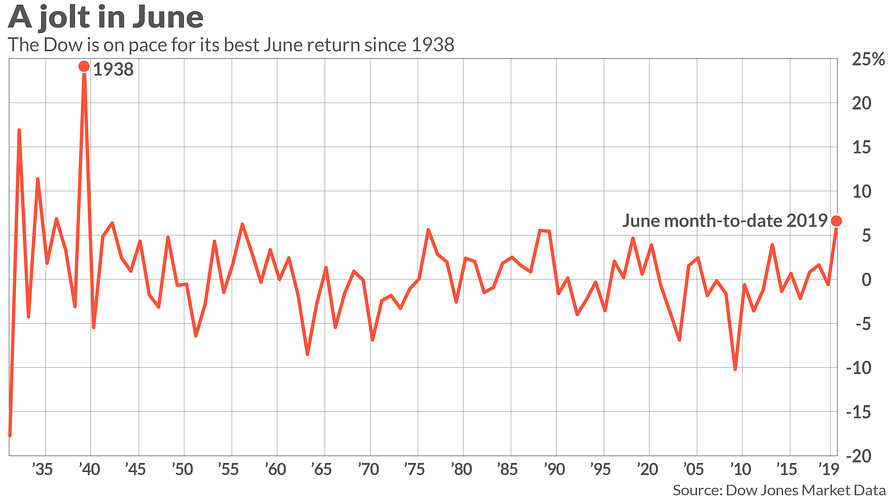
That certainly was an impressive rally if you bought into the markets on June 1st.
Unfortunately, what the headlines don’t tell you is that the “strongest June rally in the last 80 years” failed to recover the losses from one of the worst May months on record as well.
In other words, most investors simply recovered previous losses.
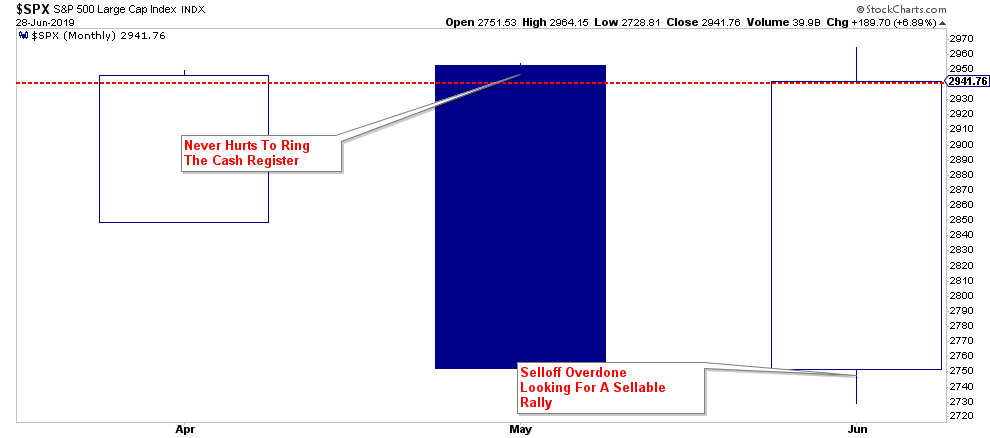
However, as noted, the rally was something we had expected and discussed repeatedly in this weekly missive.
“In the very short-term, the markets are oversold on many different measures. This is an ideal setup for a reflexive rally back to overhead resistance.”
The question now is “how much more rally is there to go?”
As we noted in last Tuesday’s update:
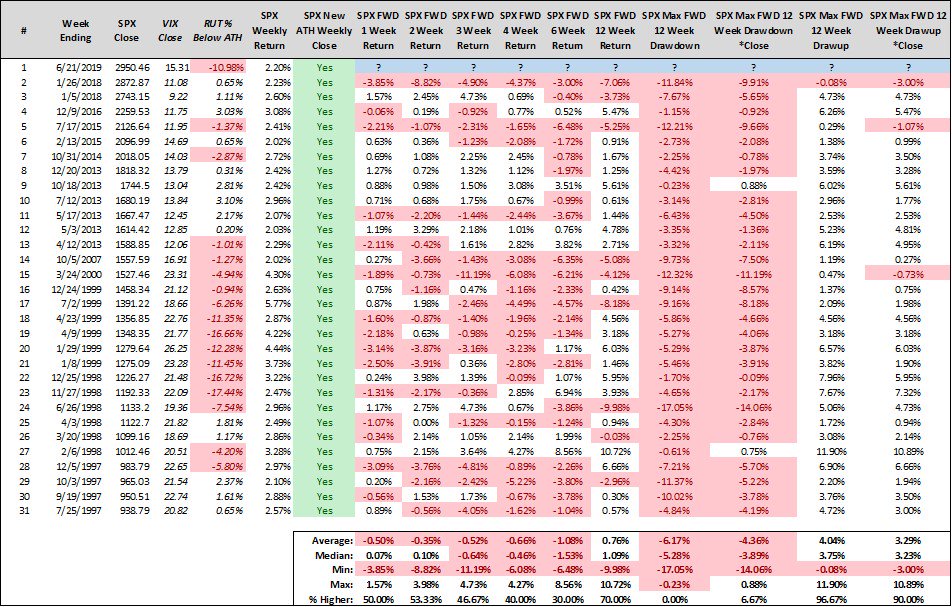
“Steve Deppe also made an important observation Twitter that when the S&P 500 has gained at least 2% in a week and finished at a new weekly high — the case on Friday — the S&P was lower six weeks later 70% of the time.”
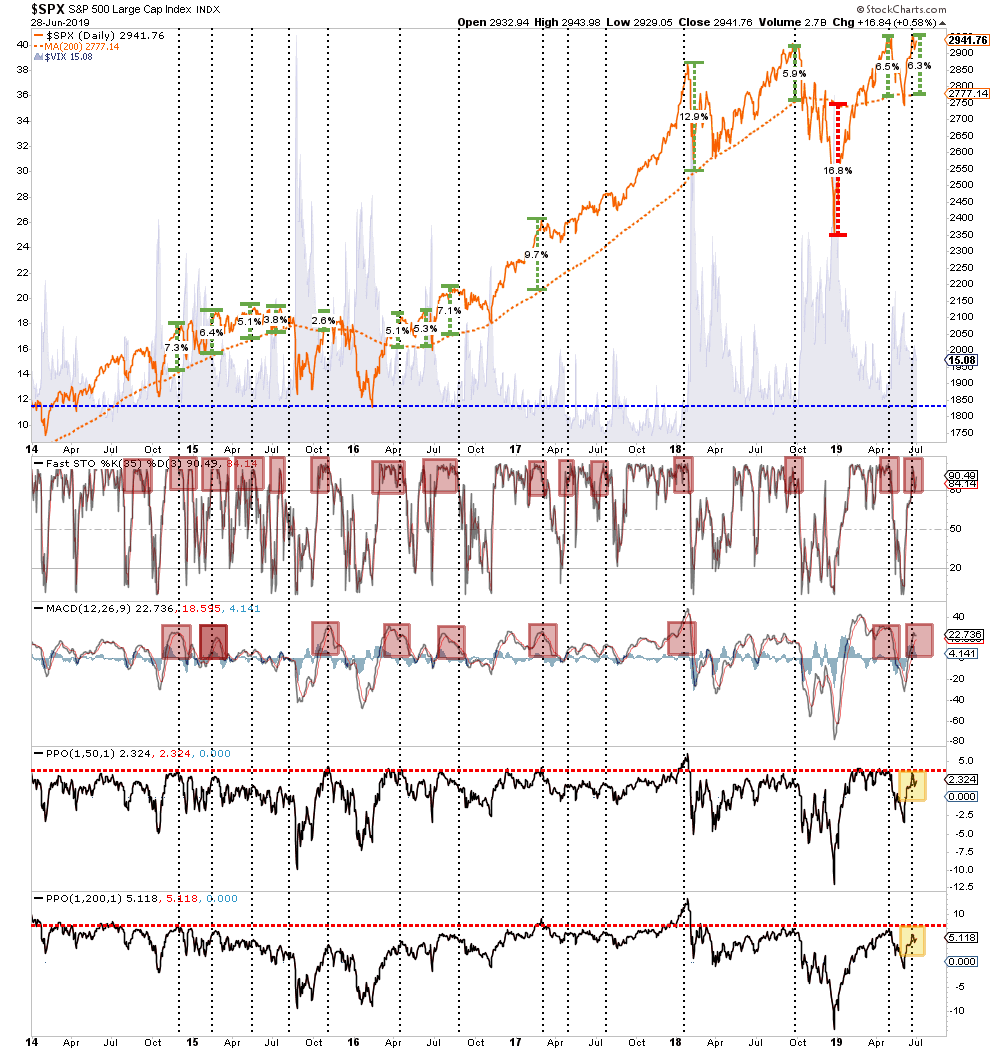
Much like an engine, markets operate on “fuel.” In other words, when there is a lot of “pent up” demand for equities, prices rise as demand is filled, and buyers are willing to pay higher prices to “get in.” The opposite is also true.
Also, prices are also confined by long-term moving averages. These moving averages, act like gravity, so when prices deviate by more than 5% from the long-term averages, reversions tend to occur.
As shown in the chart below, the market is currently very overbought, little pent-up demand, and is more than 6% above its 200-DMA.
Interestingly, this was exactly the same analysis we ran in May when we suggested taking profits then. To wit:
““From a portfolio management standpoint, the reality is that markets are very extended currently and a decline over the next couple of months is highly likely. While it is quite likely the year will end on a positive, particularly after last year’s loss, taking some profits now, rebalancing risks, and using the coming correction to add exposure as needed will yield a better result than chasing markets now.”
Since May:
- The economic backdrop has weakened materially.
- Earnings expectations continue to fall. .
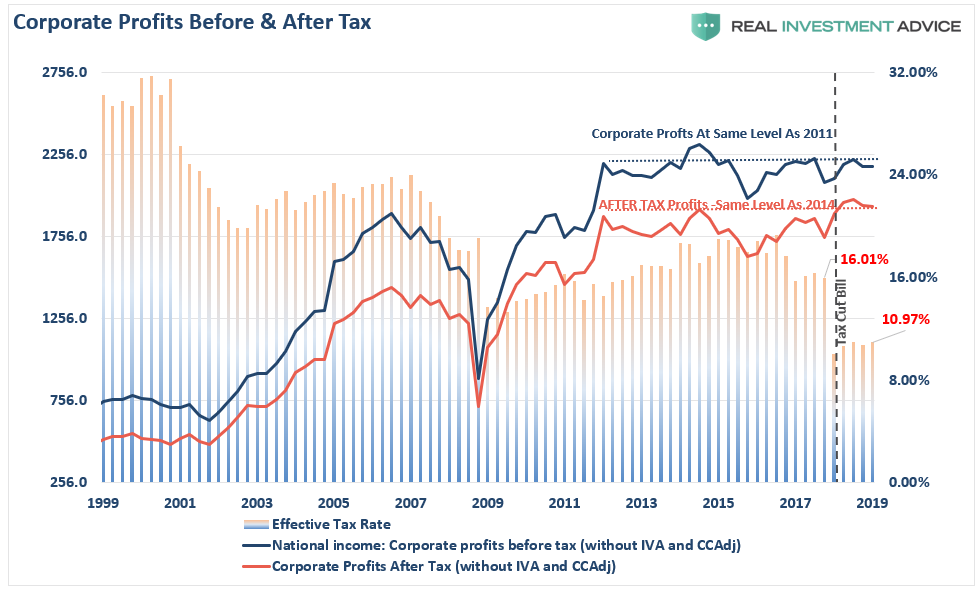
- While asset prices are near record highs, corporate profits are the same level as in 2014.
- The Fed has NOT cut rates yet and is still reducing their balance sheet.
- Global economic growth continues to weaken.
- Existing tariffs are continuing to work their way through the system
- Recession risks have risen markedly in recent months.
In other words, the supportive backdrop for equity investors is hinged on the “hope” of the Fed cutting rates and a resolution to the “trade war.”
Monday is that start of Q3 for money managers so a rally is expected that could well push markets to new highs temporarily.
This is why we remain long equities currently, we are hedged with an overweight position in cash, are maintaining our fixed income exposure and have recently added plays to participate with a “steepening” yield curve.
However, there are bigger risks still at play and worth watching.
Art Of The Deal Versus The Art Of War
This weekend, all eyes are focused on the meeting between President Trump and President Xi Jinping. If this were a pay-per-view event, it might well rival the “Silva vs. Franklin” matchup at UFC 147 for total viewership. (That’s a joke, it was one of the lowest viewed PPV ever for the UFC)
Kidding aside, there was a tremendous amount of “hope” currently built into the market for a “trade war truce” this weekend. However, as we suggested previously, the most likely outcome was a truce…but no deal.
That is exactly what happened. As noted by CNBC:
“Both sides confirmed in separate comments that they did not plan to levy any new tariffs against each other’s products at the present time. For one, Chinese state-run press agency Xinhua described the meeting result as the presidents agreeing ‘to restart trade consultations between their countries on the basis of equality and mutual respect.’
Speaking after the bilateral, Trump said it had gone as well as it could have, and that negotiations with China would continue. ‘We are right back on track,’ the president said.”
While the markets will likely react positively next week to the news that “talks will continue,” the impact of existing tariffs from both the U.S. and China continue to weigh on domestic firms and consumers.
More importantly, while the continued “jawboning” may keep “hope alive” for investors temporarily, these two countries have been “talking” for over a year with little real progress to show for it outside of superficial agreements.
Importantly, we have noted that Trump would eventually “cave” into the pressure from the impact of the “trade war” he started.
This was evident in this weekend’s agreement:
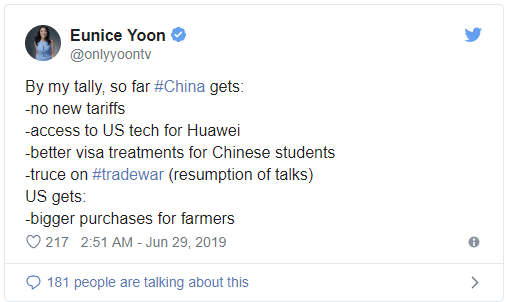
By agreeing to continue talks without imposing more tariffs on China, China gains ample running room to continue to adjust for current tariffs to lessen their impact. More importantly, Trump gave up a major bargaining chip – Huawei.
“One of the things I will allow, however, is — a lot of people are surprised we send and we sell to Huawei a tremendous amount of product that goes into a lot of the various things that they make — and I said that that’s OK, that we will keep selling that product.”
No, a lot of people weren’t surprised, just Trump as there has been pressure applied by U.S. technology firms to lift the ban on Huawei. While he may have appeased his corporate campaign donors for now, Trump gave up one of the more important “pain points” on China’s economy.
This gives China much needed room to run.
Let’s review what we said a couple of months ago as to why their will ultimately be no deal.
“The problem, is that China knows time is short for the President and subsequently there is ‘no rush’ to conclude a ‘trade deal’ for several reasons:
- China is playing a very long game. Short-term economic pain can be met with ever-increasing levels of government stimulus. The U.S. has no such mechanism currently, but explains why both Trump and Vice-President Pence have been suggesting the Fed restarts QE and cuts rates by 1%. (Update: Trump says the U.S. should have Mario Draghi at the helm of U.S. monetary policy.)
- The pressure is on the Trump Administration to conclude a “deal,” not on China. Trump needs a deal done before the 2020 election cycle AND he needs the markets and economy to be strong. If the markets and economy weaken because of tariffs, which are a tax on domestic consumers and corporate profits, as they did in 2018, the risk off electoral losses rise. China knows this and are willing to ‘wait it out’ to get a better deal.
- As I have stated before, China is not going to jeopardize its 50 to 100-year economic growth plan on a current President who will be out of office within the next 5-years at most. It is unlikely, the next President will take the same hard line approach on China that President Trump has, so agreeing to something that is unlikely to be supported in the future is unlikely. It is also why many parts of the trade deal already negotiated don’t take effect until after Trump is out of office when those agreements are unlikely to be enforced.
In the meantime, as noted in #3 above, corporate profits continued to come under pressure. As noted previously, corporate profits have declined over the last two quarters and are at the same level as in 2014 with the stock market higher by almost 60%.
But, if you think China is going to acquiesce any time soon to Trump’s demands, you haven’t been paying attention. China has launched a national call in their press to unify support behind China’s refusal to give into Trump’s demands. To wit:
“Lying behind the trade feud is America’s intention to stifle China’s development. The U.S. wants to be a permanent leader in the world, and there is no way for China to avoid the ‘storm’ through compromise.
History proves that compromise only leads to further dilemmas. During previous trade tensions between the U.S. and Japan, Japan made concessions. As a result, its political stability and economic development were adversely affected, with structural reform being suspended and hi-tech companies being severely damaged.
China, with a population of 1.4 billion, is the world’s largest manufacturing base. Industrial upgrading and hi-tech innovation are crucial to China’s economic development. China needs to leave more resources to its descendants by protecting the environment, and reaping the dividends of further opening-up. These are the core interests of China, and it will never give them up.
The only way for a country to win a war is through development, not compromise. To achieve development, China will open its door wider to the world and fight to the end.”
These are Xi Jinping’s mandates, dictated directly from his party, for the meeting with the United States president in Osaka.
The only possible outcome for Trump was exactly what happened. Nothing. Just an agreement to talk more.
While Trump may be following his “Art Of The Deal” tactics, Xi is clearly operating on the foundation of Sun Tzu’s “The Art Of War.”
“If your enemy is secure at all points, be prepared for him. If he is in superior strength, evade him. If your opponent is temperamental, seek to irritate him. Pretend to be weak, that he may grow arrogant. If he is taking his ease, give him no rest. If his forces are united, separate them. If sovereign and subject are in accord, put division between them. Attack him where he is unprepared, appear where you are not expected.“
China has been attacking the “rust-belt” states, which are crucial to Trump’s 2020 re-election, states with specifically targeted tariffs. As noted by MarketWatch:
“China has lashed back with tariffs on $110 billion in American goods, focusing on agricultural products in a direct and painful shot at Trump supporters in the U.S. farm belt.”
While Trump is operating from a view that was a ghost-written, former best-seller, in the U.S. popular press, XI is operating from a centuries-old blueprint for victory in battle.
China clearly won this round, and the pressure is now squarely on Trump to get a deal done before the 2020 election.
That isn’t likely going to happen.
Warning Signs
While markets remain solely focused on the outcome of the G-20 meeting and expectations the Fed will cut rates at the July meeting (which is not assured by any means) warning signs of potential risk continue to mount.
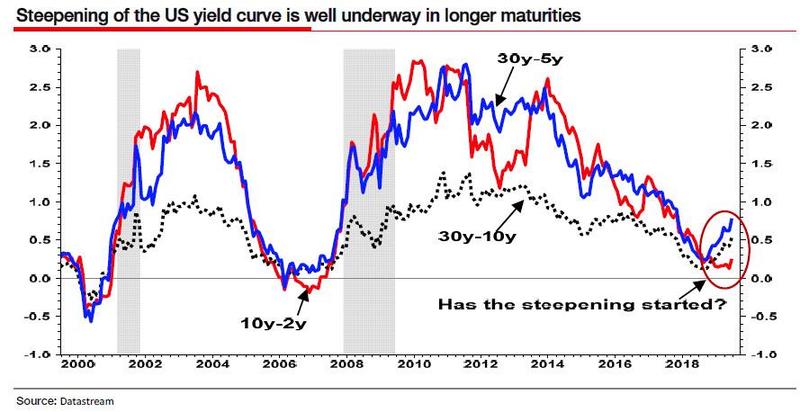
One of the more important indicators we have discussed previously is the reversal of yield curve inversions. My colleague Albert Edwards confirmed that analysis this past week:
“However, while the inversion was certainly a memorable event, the question on everyone’s lips is how do risk assets perform once the curve flattens and/or inverts. According to backtests from Goldman, since the mid-1980s, significant stock drawdowns (i.e. market crashes) began only when term slope started steepening after being inverted.
In other words, as we noted then, “Curve Inversion Is Bad, But It’s The Steepening After That Kills.”
Fast forward to today, when in his latest bearish missive, SocGen’s permabear Albert Edwards picks up where we left off, and in a note titled “the final recession shoe has now fallen”, he notes that while inversion of the US yield curve is seen as a reliable precursor to US recessions, “it has a long and variable lead time”, and instead “a far more immediate and present danger of recession occurs when after inversion, a rapid steepening occurs.”
Sound familiar?
In any case, as we first commented in early 2019, Edwards notes that this subsequent steepening “usually informs investors the cycle is over and it is time to flee for the hills.“
Well, for those who haven’t figured out the punchline yet, rapid curve steepening is now occurring, and as Edwards gleefully concludes, this ‘suggests recession may indeed either be imminent or else it has already arrived.'”
Another concern we have also discussed previously is the issue with margin debt.
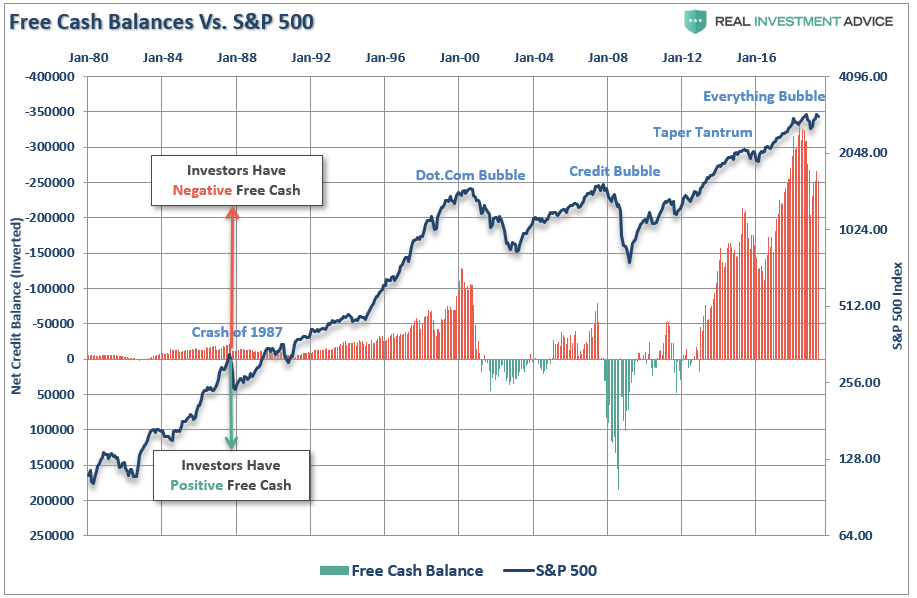
While the consolidation of the market over the last 18-months has led to a slight reduction in the amount of outstanding margin debt, there has been very little overall deleveraging of the market.
The chart below analyzes margin debt in the larger context that includes free cash accounts and credit balances in margin accounts. The chart below is based on nominal data, not adjusted for inflation and has retained the NYSE data through November 2017 and switched to the FINRA data moving forward.
It is important to understand that leverage is a “double-edged sword.”
When markets are rising, the leverage adds to the “buying power” of investors lifting asset prices higher. However, it also works in reverse, but more like an explosion rather than a slow burn.
However, as Jesse Felder noted this past week:
“The latest margin debt figures were released last week and they show leveraged investors continue to delever. In fact, margin debt is now falling at an annual rate of 15%, a level of derisking that has always been accompanied by a minimum 20% decline in the S&P 500 over the past half century.
This makes this latest episode of derisking fairly unique. There have only been a couple of other precedents in which stocks rose or were flat year-over-year while margin debt fell at at least a 15% rate: May of 1969 (margin debt down 15%/stocks up 10%) and June of 1973 (margin debt down 18%/stocks flat). January of 2001 (margin debt down 20%/stocks down 1%) also comes very close.”
It is worth noting that those three previous periods on slightly preceded much more meaningful declines.
- The 1969 event gave way to a near 40% decline in 1970-1971
- 1973 preceded the 1974 “black bear” market which eclipsed a 50% decline in total.
- Of course, January 2001 was the precursor to the “dot.com” crash which also entailed a 50% decline.
Are you seeing a pattern here?
While the current contraction in margin debt is somewhat unique, it may only be the case temporarily. As shown in the chart below (I have inverted margin debt to the S&P 500) the amount of contraction needed to reverse the leverage in the market will require a similar 50% decline in asset prices as seen previously.
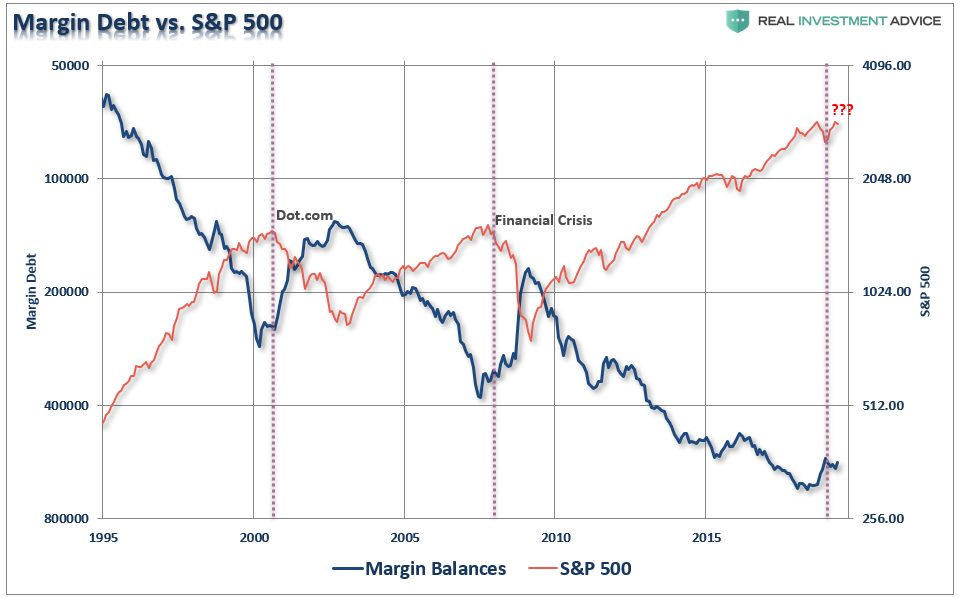
Yes, this time could absolutely be different.
But from a portfolio management perspective, it probably isn’t the best “bet” to make.
