As a proud graduate of “The School of Whatever Works” I for one am not afraid to “get down in the weeds” when it comes to finding ways to get an edge in the stock market. Take for example the 40-week cycle in the stock market.
I have written about this cycle several times in the past so I won’t go into a long-winded explanation here. To make a long story short, it goes like this:
Our test starts on 9/8/1967.
- A new 40-week cycle starts exactly every 280 days after that
- The 1st 20 weeks of the cycle is considered “bullish”
- The 2nd 20 week of the cycle is considered “bearish”
(DO NOT STOP READING – I know, it sounds ridiculous, right? But at least consider the results detailed below)
For testing and actual trading purposes:
- During the “bullish phase” we will hold a long position in the Dow Jones Industrial Average
For actual trading purposes:
- A 12.5% stop is used as follows: If the Dow Jones Industrials Average declines 12.5% or more on a closing basis from its price at the start of the latest 40-week cycle, the “bullish” phase of the cycle ends (to put it mildly) and the “bearish phase” begins at the close of the next trading day (this has happened twice – in 1974 and in 2008).
- We will assume that interest is earned at an annual rate of 1% while out of the stock market.
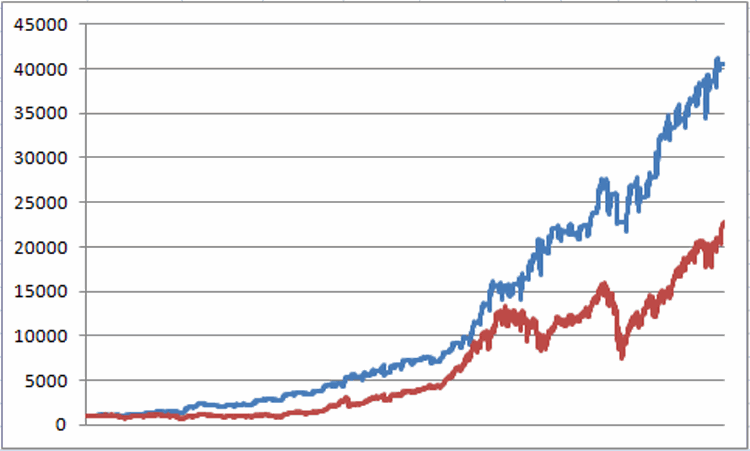
Figure 1 displays the growth of $1,000 invested since 1967using the “system” detailed above versus buying and holding the Dow.
Figure 1 – Growth of $1,000 using the 40-Week Cycle System described above (blue line) versus buying and holding the Dow Jones Industrials Average(red line); 9/8/1967-2/7/2017.
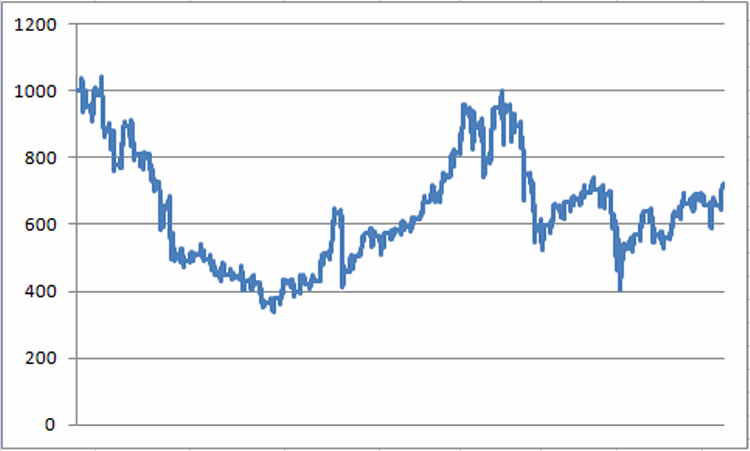
To put things in perspective, Figure 2 displays the growth of $1,000 invested in the Dow ONLY during every “bearish phase” since 1967.
Figure 2 – Growth of $1,000 invested in Dow Jones Industrials Average only during “bearish phases”; 9/8/1967-2/7/2017.
For the record, since 1967:
- There have been 65 completed 40-week cycles
- The “bullish phase” has showed a gain 49 times (75%)
- The “bearish phase” has showed a gain 36 times (55%)
- The “bullish phase” has generated a net gain of +3,957%
- The “bearish phase” has generated a net loss of (-27%)
- Buying and holding the Dow has generated a net gain of +2,175%
The next 40-week cycle begins at the close on 2/17/2017. The “bullish phase” extends through the close on 7/7/2017.
Welcome to “the weeds”.
Disclaimer: The data presented herein were obtained from various third-party sources. While I believe the data to be reliable, no representation is made as to, and no responsibility, warranty or liability is accepted for the accuracy or completeness of such information. The information, opinions and ideas expressed herein are for informational and educational purposes only and do not constitute and should not be construed as investment advice, an advertisement or offering of investment advisory services, or an offer to sell or a solicitation to buy any security.

