Egypt, Turkey, Lebanon and Paris, all in a matter of weeks. The G20 met in Turkey this weekend. I doubt any world leaders were thinking economics. We saw the huddles and heard the dialog. The Paris bombings pushed dealing with terrorism to the top of the agenda. Whether or not the global financial markets are impacted will depend on whether or not a global coordinated response is effective in making the world a safer place. In the meantime, Paris, which generates about 7.5% of its economy from tourism will take a hit along with most other major cities in Europe as foreign travelers change their travel plans. Hotels, airlines and luxury good companies will be most affected. The attacks will also complicate the acceptance and integration of the hundreds of thousands of refugees who are moving into Europe. While a young population looking for work should be a positive to the many aged European populations, the attacks could delay the benefit and leave many refugees stranded during the winter months. These events will make for more difficult times for many.
The markets suffered a broad setback after six straight positive weeks…
While the markets deserved a week of rest, the strong U.S. dollar, weak commodity prices and a strong move lower in credit led to a painful hangover in most every U.S. sector. Only the Utility stocks finished with gains due to their relationship with fixed income. Energy was hit the most because of the 8% hit to crude oil on the week.
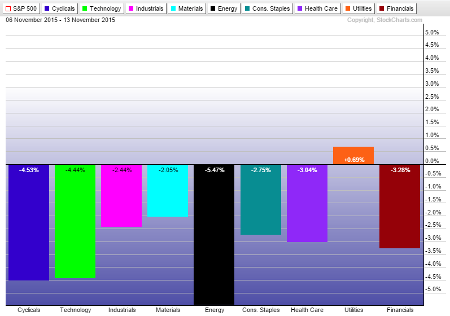
A look at the major assets down 4%+ on the week shows broad selling…
Energy and commodity assets and related equities would have been expected to be on the list given the continued U.S. dollar strength. More surprising was seeing Apple (O:AAPL), Small Caps, Semis, Tech and Consumer Discretionary. Banks and Financials also did not like the backing off in rates.
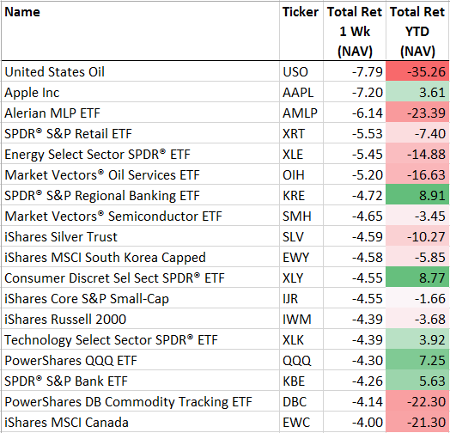
(as of 11/13/15)
And as we have discussed, the volatility in individual names remains significant…
Here is a list of names falling 15%+ on the week. Many very familiar and widely owned companies. Most all have done terribly year-to-date and just keep falling.
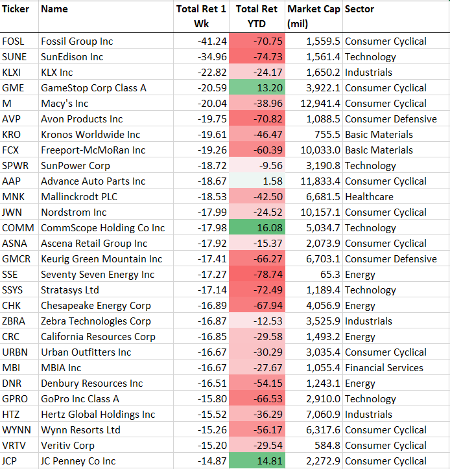
(as of 11/13/15)
One sector that was crushed last week was Retail behind several very disappointing earnings announcements. Here were Macy's (N:M) comments…

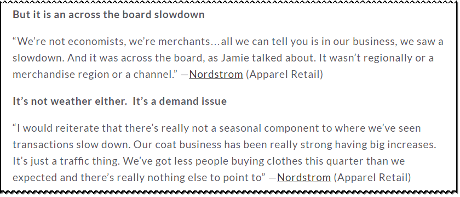
Nordstrom (N:JWN) gave you the impression that it wasn’t regional or weather related but just fewer department store shoppers…
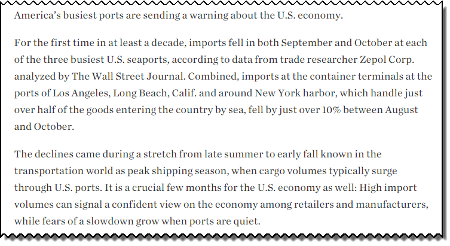
We wrote about high inventories last week. Now we are getting the news about slowdowns at the major U.S. shipping ports…
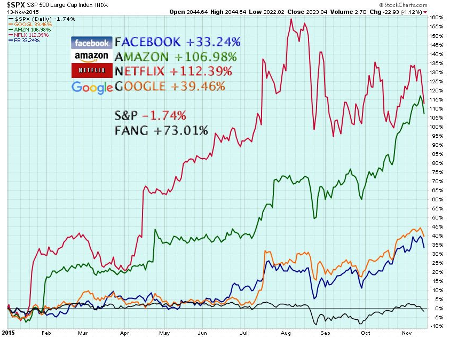
But not all stocks are seeing sharp declines…
@OMillionaires: #FANG keeps going, now up 73% YTD vs. 57% Oct 3rd while S&P down 1.7% – $1.1 trillion in market cap for 4 companies
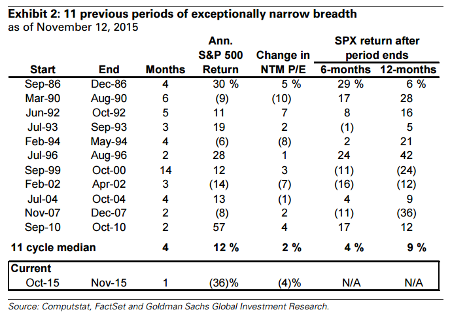
About the very narrow breadth in the market, Goldman Sachs (N:GS) says not to worry…
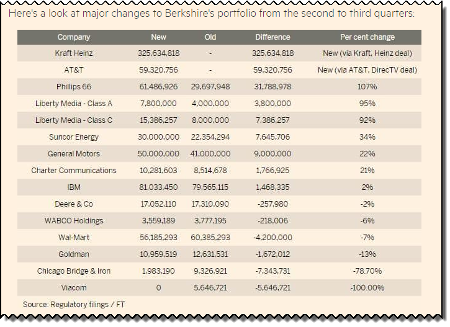
Berkshire (N:BRKb) updated its holdings over the weekend. This could be classified as the anti-FANG portfolio…
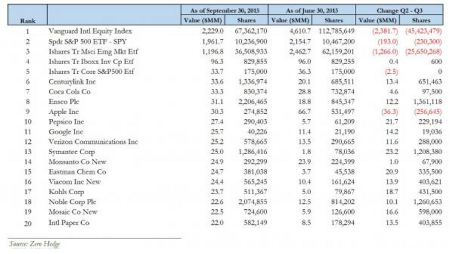
Updated holdings also showed the largest active investor in the market pulling hard out of International equities in Q3…
Bridgewater sold 41% of its holdings in the world’s two largest EM ETFs in the third quarter amid a rout in developing-nation assets. Specifically, it cut its investments in Vanguard Group Inc. and BlackRock Inc.’s (N:BLK) ETFs to a combined 104 million shares, from 175 million in the previous three-month period. The value of the ETF holdings dropped more than 50 percent to $3.4 billion as a result of share price declines and the divestments. In other words, if anyone is looking for the culprits behind the aggressive ETFlash Crash of August 24, Bridgewater may indeed be a good starting point. As a result of this major unwind in Emerging Market exposure, Bridgewater’s total US public equity holdings dropped 31%.
More recently, with the 6 week bounce in equities, investors elected to pocket many of their chips in the last week…
Investors withdrew $12.5 billion from U.S. stock mutual funds last week, the biggest redemption in more than four years – About $12.1 billion came out of domestic stock funds, according to a statement Wednesday by the Investment Company Institute, a Washington-based trade group. Equity funds that invest outside the U.S. saw withdrawals of $461 million. The equity redemptions for the period ended Nov. 4 were the largest since the week ended Aug. 10, 2011, when $27.8 billion was pulled.
(Bloomberg)
Investors also decided to put an end to the IPO business for the rest of 2015…

For the most active investors, the hedge fund hotel has become a most terrifying place to stay. Here are some of the top hedge fund holdings among the most aggressive and activist funds…

Liquid investments aren’t the only valuations being sliced. Here the 4th largest Unicorn gets a haircut from its public mutual fund owner…
Which, as valuations are now falling, raises the question regarding whether or not public mutual funds should own illiquid equities that don’t have daily pricing.

One answer that many would like to know is why a top Internet investor just sold 3/4 of his Facebook (O:FB)?

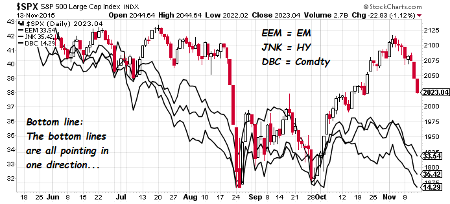
Back to why the big sell off in stocks last week? Look again to falling Commodities, Emerging Markets and High Yield laying the pavement to lower stock prices…
Among commodities, the selling in silver just will not stop…
N:SLV had its 10th-consecutive day in the red – the ETF’s longest such stretch since its 2006 launch – nearing recent lows… Last week we noted the historically persistent selloff in gold, and now silver has joined it. Silver has declined for the past 10 sessions for only the third time in 50 years. The others were November 23, 2000, and September 11, 2008, after which it rallied +4% and +30%, respectively, over the next couple of weeks. Even in the midst of bear markets, this kind of selling pressure is almost always at least partially reversed. We’d have a lot more confidence in that outlook for a bounce if sentiment was showing more pessimism than it is now
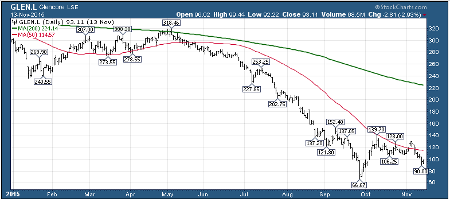
So watch Glencore (L:GLEN) because you remember how the equity and credit markets flipped out the last time it went into freefall…
Oil prices getting close again to their August lows…
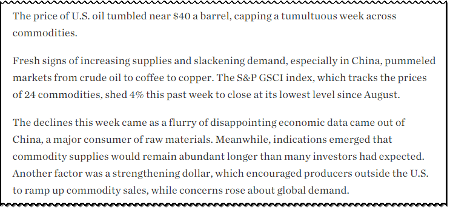
Speaking of increasing oil supply, here comes Iraq…
Iraq, the fastest-growing producer within the 12-nation group, loaded as many as 10 tankers in the past several weeks to deliver crude to U.S. ports in November, ship-tracking and charters compiled by Bloomberg show. Assuming they arrive as scheduled, the 19 million barrels being hauled would mark the biggest monthly influx from Iraq since June 2012, according to Energy Information Administration figures.
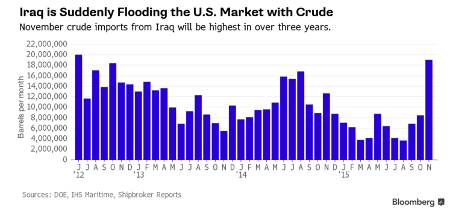
The Iraq supplies will hit already bulging U.S. storage…

As lower metal prices threaten Glencore, lower energy prices will threaten many energy lenders…
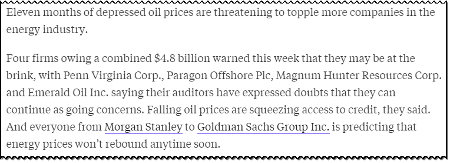
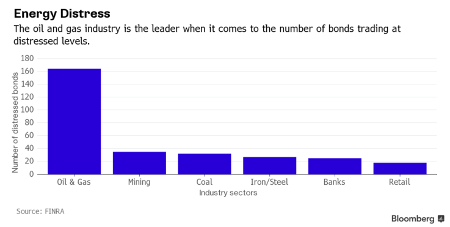
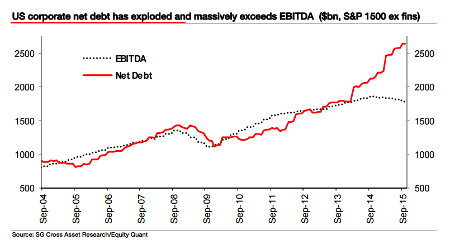
If commodity prices buckle lower, the question will be whether or not the markets can make it through a downturn with the increase in debt…
This feels all so familiar. Almost no-one believes that this cycle will end badly. Central bankers have successfully blamed the disastrous 2008 Global Financial Crisis on everybody else except themselves. The markets have fallen for this self-serving nonsense and feel comforted that the central banks have put in place better regulations, bigger capital buffers and stronger fire breaks to prevent everyone else’s mistakes. But they miss the critical point. Monetary policy remained too loose for too long in the noughties and allowed a credit bubble to take hold which blew up in their complacent faces when they tried to normalize interest rates.
Although commodity prices are falling and Treasury yields did decline in the last week, the longer term trend line is being tested. Are incremental investors positioning for higher yields? If so, where will they hide for safe returns?
Looks like a really good time to own a business or real estate in Hawaii…
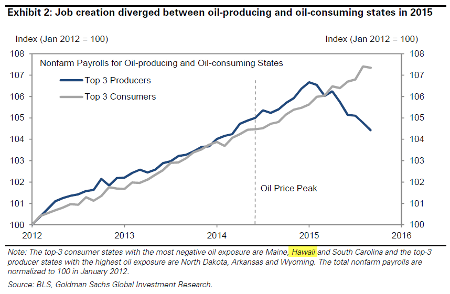
A most amazing story of the week for anyone who has managed money under a Board of Trustees… Wow.
Late last month, two of Sequoia's (L:SEQI) five independent directors, Vinod Ahooja and Sharon Osberg, abruptly resigned a rare and public sign of dissent within a mutual fund’s board. Sequoia gave no reason for the departures, but they came just days after a contentious board meeting in which the fund’s managers revealed they had bought more shares in the embattled drug maker Valeant Pharmaceuticals (N:VRX) International, despite objections by the independent directors. All the directors had repeatedly expressed concern over the size of an already large stake in Valeant. The managers disclosed the purchase of an additional 1.5 million shares, increasing Sequoia’s stake in Valeant to more than 10 percent and making it the company’s largest shareholder.
Credit Suisse (VX:CSGN) goes out early with their 2016 outlook…
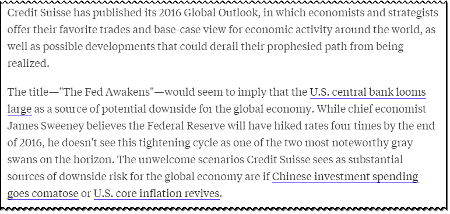
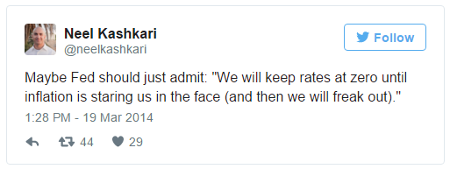
Given their risk outlook, Credit Suisse would approve this new Fed selection…
I wonder if UFC 194 should be held in Washington DC. The FOMC may be in need of a future cage with Neel joining the Board.
The information presented here is for informational purposes only, and this document is not to be construed as an offer to sell, or the solicitation of an offer to buy, securities. Some investments are not suitable for all investors, and there can be no assurance that any investment strategy will be successful. The hyperlinks included in this message provide direct access to other Internet resources, including Web sites. While we believe this information to be from reliable sources, 361 Capital is not responsible for the accuracy or content of information contained in these sites. Although we make every effort to ensure these links are accurate, up to date and relevant, we cannot take responsibility for pages maintained by external providers. The views expressed by these external providers on their own Web pages or on external sites they link to are not necessarily those of 361 Capital.
