
Teradyne Inc. (NYSE:TER) reported third-quarter 2016 earnings of 33 cents per share, surpassing the Zacks Consensus Estimate of 27 cents. Adjusted earnings per share exclude one-time items but include stock-based compensation expense.
Following the better-than-expected results, the share price surged more than 11% in the after-hour trading.
Revenues
Revenues of $410.0 million decreased 22.8% sequentially and 11.9% year over year. However, the figure came above the Zacks Consensus Estimate of $392.0 million and management’s guided range of $375–$405 million.
Approximately 79% of revenues came from semiconductor testing platforms, 9% from system test business, 7% from wireless test, and the remaining 5% from Industrial Automation.
Bookings
Total orders amounted to $378.0 million, down 19.7% sequentially. On a sequential basis, Semiconductor Test orders were down 36.1% to $250.0 million and Industrial Automation orders were down 7.7% to $24.0 million.However, Systems Test orders increased 153.3% to $76 million and Wireless Test Group orders decreased 26.1% to $24 million.
Margins
Pro-forma gross margin was 55.5%, up 233 basis points (bps) sequentially but down 1 bp year over year. The sequential increase was due to a favorable mix.
Total adjusted operating expenses of $149.5 million decreased 5.6% sequentially and 1.3% year over year. As a percentage of sales, both engineering & development expenses and selling & administrative expenses increased. As a result, adjusted operating margin came in at 19.1%, down 430 bps sequentially and 392 bps year over year.
GAAP net loss was $63.8 million in the third quarter. In the prior-year quarter, the company had reported earnings of $71.5 million. Excluding special items but including stock-based compensation expense, non-GAAP net income came in at $67.7 million or 33 cents per share compared with $84.9 million or 40 cents in the year-ago quarter.
Balance Sheet
Teradyne ended the quarter with cash and cash equivalents and marketable securities balance of $896.4 million, up from $823.2 million in the prior quarter. Trade receivables were $163.2 million, down from $349.5 million in the last quarter.
Cash flow from operations was $203.8 million compared with $180.7 million in the previous quarter. Capex was $19.7 million compared with $26.3 million in the second quarter.
Share Repurchase/Dividend
In the reported quarter, Teradyne spent $28.3 million on share repurchases and paid out $12.1 million as dividend.
Q4 Guidance
Management expects fourth-quarter revenues in the $330–$360 million range, up 15.9% sequentially at the mid-point. The Zacks Consensus Estimate is pegged at $313.3 million.
Non-GAAP earnings per share from continuing operations are likely to range within 18 cents to 25 cents. The Zacks Consensus Estimate is pegged at 10 cents. GAAP earnings are expected in the range of 17–26 cents.
Conclusion
Teradyne is a leading provider of automated test equipment. The company reported decent third-quarter results, with both the top line and the bottom line outperforming the respective Zacks Consensus Estimate.
Given the popularity of its products, the Universal Robots acquisition and continuous design wins, we are optimistic about Teradyne’s performance over the long term. However, weakness in the wireless test market could be a concern in the near term.
TERADYNE INC Price, Consensus and EPS Surprise
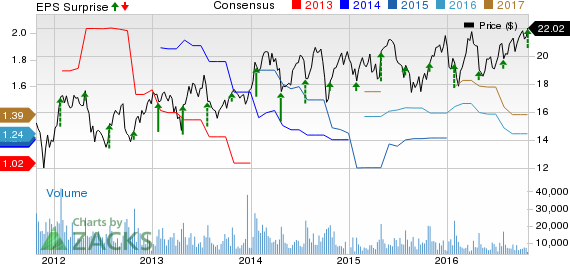
TERADYNE INC Price, Consensus and EPS Surprise | TERADYNE INC Quote
Stocks to Consider
Currently, Teradyne has a Zacks Rank #3 (Hold). Better-ranked stocks in the industry include Intel Corp. (NASDAQ:INTC) , Applied Materials, Inc. (NASDAQ:AMAT) and ON Semiconductor Corp. (NASDAQ:ON) , each carrying a Zacks Rank #2 (Buy). You can see the complete list of today’s Zacks #1 Rank (Strong Buy) stocks here.
Intel delivered a positive earnings surprise of 12.14%, on average, in the trailing four quarters.
Applied Materials delivered a positive earnings surprise of 5.05% in the trailing four quarters.
ON Semiconductor delivered a positive earnings surprise of 4.58% in the trailing four quarters.
Confidential from Zacks
Beyond this Analyst Blog, would you like to see Zacks' best recommendations that are not available to the public? Our Executive VP, Steve Reitmeister, knows when key trades are about to be triggered and which of our experts has the hottest hand. Click to see them now>>
INTEL CORP (INTC): Free Stock Analysis Report
ON SEMICON CORP (ON): Free Stock Analysis Report
APPLD MATLS INC (AMAT): Free Stock Analysis Report
TERADYNE INC (TER): Free Stock Analysis Report
Original post
Zacks Investment Research