Get 40% Off
👀 👁 🧿 All eyes on Biogen, up +4,56% after posting earnings. Our AI picked it in March 2024.
Which stocks will surge next?
Unlock AI-picked Stocks

Technology Stocks Lead The Market Higher, But It May Not Last

Published 05/25/2021, 02:03 AM
Updated 09/20/2023, 06:34 AM

Stocks finished the day, yesterday, mostly higher driven by the top 5 or 6 stocks in the S&P 500. The problem here is that these stocks haven’t done anything for a while and are at their own important resistance levels.

So either Amazon (NASDAQ:AMZN), Apple (NASDAQ:AAPL), Nvidia (NASDAQ:NVDA), Microsoft (NASDAQ:MSFT), et al., will need to break out of their resistance zones, or new leadership will need to emerge today, which is certainly possible.

NASDAQ

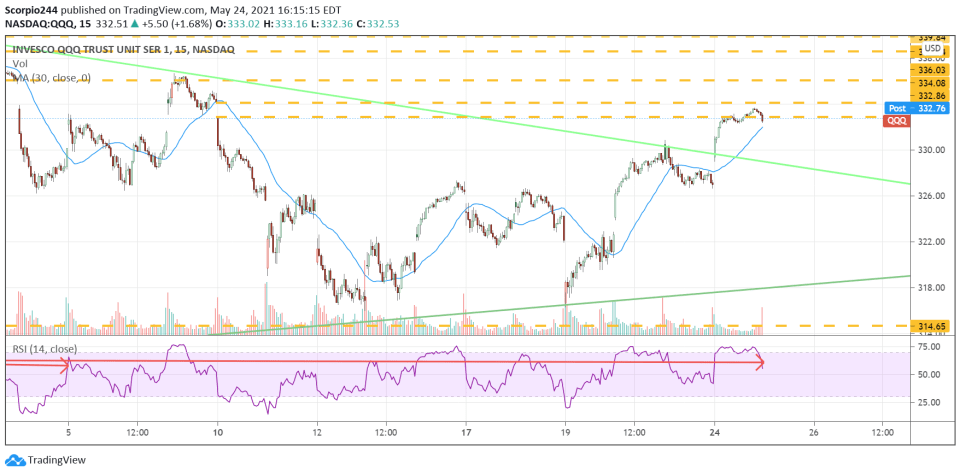
The Invesco QQQ Trust (NASDAQ:QQQ) was trying to fill its own gaps, which was around $334. We got pretty close on Monday, perhaps close enough to consider the gap filled.

I don’t see any more gaps that need to be filled on the upside, but there are plenty of gaps that need to be filled at lower prices. It would not be surprising to see the Qs drop back to $322 over the next few days, no. That is why I do generally not believe in Monday's rally.

QQQ Chart

Technology

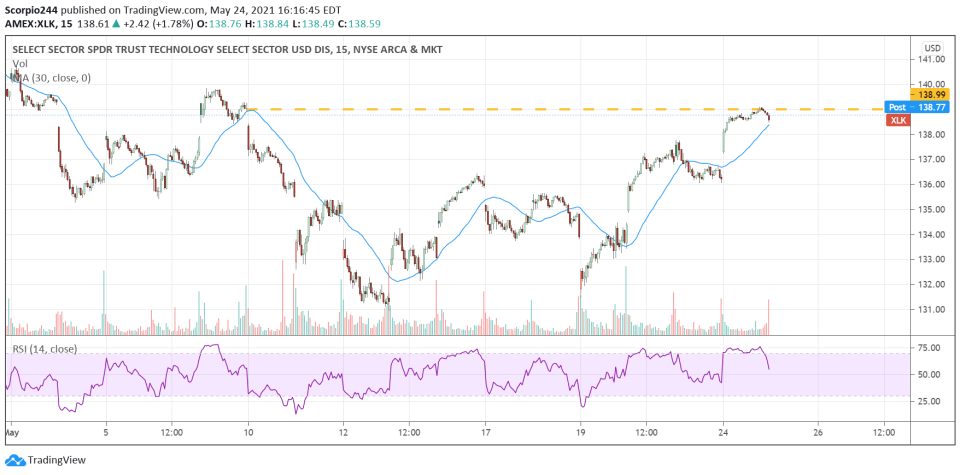
The gap on the Technology Select Sector SPDR® Fund (NYSE:XLK) did close completely yesterday and sold off promptly thereafter.

XLK Chart

Amazon

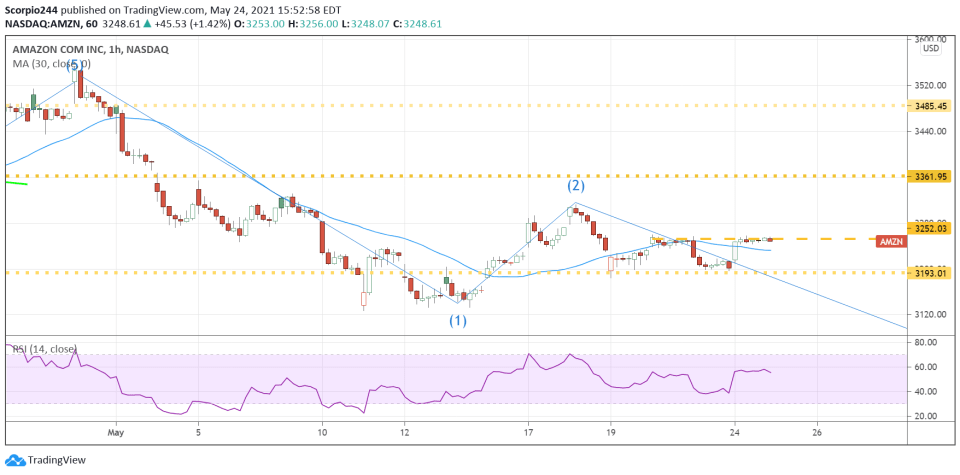
Amazon.com (NASDAQ:AMZN) was the best example of this as the stock has struggled the past few days at the $3,250 price.

Amazon 1-Hr Chart

Apple

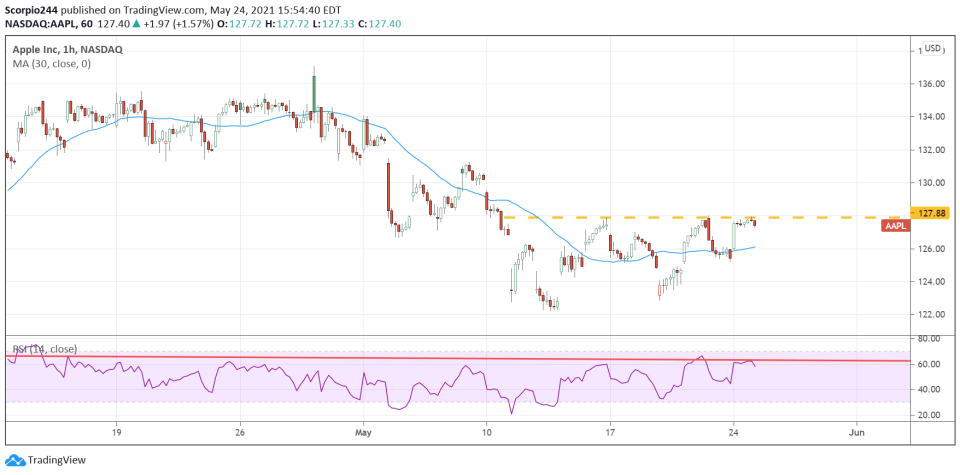
Apple (NASDAQ:AAPL) also struggled at resistance Monday around $128.

Apple 1-Hr Chart

Tesla

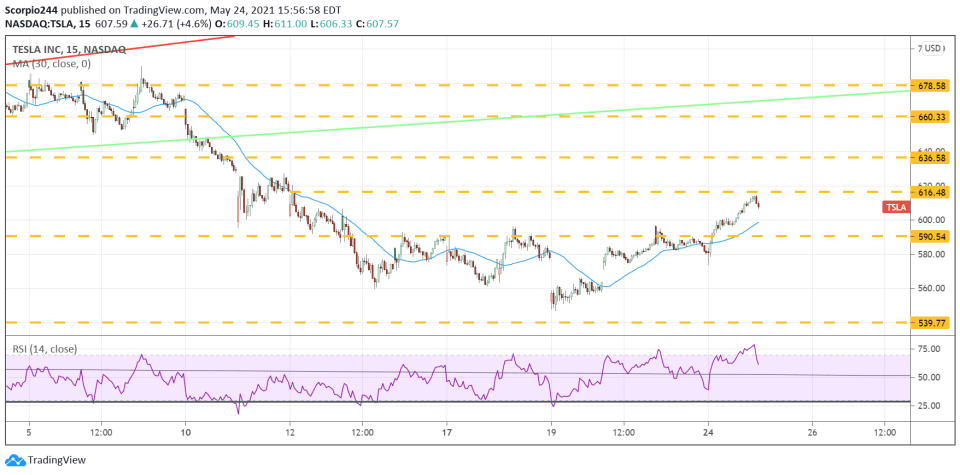
Tesla (NASDAQ:TSLA) managed to fill a gap around $616, and then it turned around after hitting that resistance level.

Tesla Chart

Nvidia

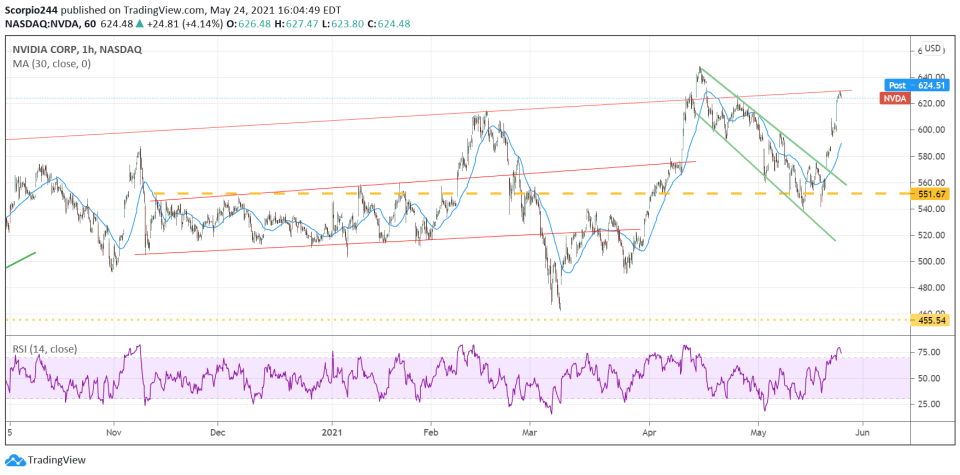
NVIDIA Corporation (NASDAQ:NVDA) rose all the way back to the upper end of its trading range and hit resistance as well.

3rd party Ad. Not an offer or recommendation by Investing.com. See disclosure here or remove ads .

Nvidia 1-Hr Chart

ARKK ETF

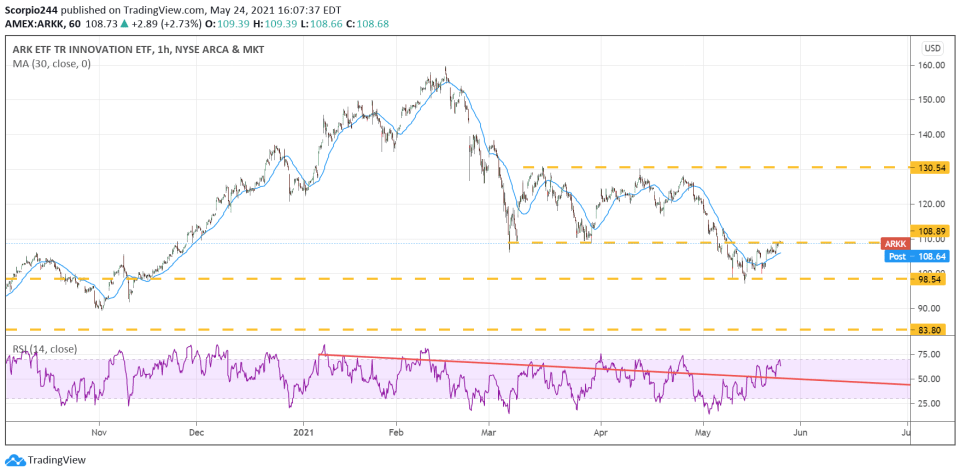
Even the ARK Innovation ETF (NYSE:ARKK) hit resistance at $109 and failed to push through.

ARKK ETF 1-Hr Chart

This seemed to indicate that there just weren’t enough buyers in the market to get through the wall of sellers waiting at various resistance levels in the market.

Low volume on the SPDR® S&P 500 (NYSE:SPY), Q, and the S&P 500 e-minis all seemed to suggest that the sellers decided to take the day off. The question is if they decide to show up today.

Original Post

Latest comments

Risk Disclosure: Trading in financial instruments and/or cryptocurrencies involves high risks including the risk of losing some, or all, of your investment amount, and may not be suitable for all investors. Prices of cryptocurrencies are extremely volatile and may be affected by external factors such as financial, regulatory or political events. Trading on margin increases the financial risks.
Before deciding to trade in financial instrument or cryptocurrencies you should be fully informed of the risks and costs associated with trading the financial markets, carefully consider your investment objectives, level of experience, and risk appetite, and seek professional advice where needed.
Fusion Media would like to remind you that the data contained in this website is not necessarily real-time nor accurate. The data and prices on the website are not necessarily provided by any market or exchange, but may be provided by market makers, and so prices may not be accurate and may differ from the actual price at any given market, meaning prices are indicative and not appropriate for trading purposes. Fusion Media and any provider of the data contained in this website will not accept liability for any loss or damage as a result of your trading, or your reliance on the information contained within this website.
It is prohibited to use, store, reproduce, display, modify, transmit or distribute the data contained in this website without the explicit prior written permission of Fusion Media and/or the data provider. All intellectual property rights are reserved by the providers and/or the exchange providing the data contained in this website.
Fusion Media may be compensated by the advertisers that appear on the website, based on your interaction with the advertisements or advertisers.
© 2007-2024 - Fusion Media Limited. All Rights Reserved.