Watching futures as the morning unfolded on the first day of June, it was nice to see a strong rally developing across the equity markets, and then less exciting to see the late morning fade and the negative closes for the S&P 500 and the NASDAQ.
A market that opens big green, and then fades and closes in the red, is not really a healthy market.
The one headline that hit this morning was that the Biden Administration was now proposing a 43% capital gains tax rate, a near 100% increase from the current 23% rate passed during the Trump Administration.
That’s a big bump in the capital gains rate – and it will likely be negotiated lower – but what will be more interesting to see what the Biden Administration and Congress propose for the stepped-up cost basis upon death. That impacts (i would think) small business, farmers, not to mention long-term investors.
Writing this post on May 24 about not yet being convinced of Tech’s and the S&P 500’s Big 5 (by market cap) trading range, given the market leadership for these stocks like Apple (NASDAQ:AAPL), Microsoft (NASDAQ:MSFT), Google (NASDAQ:GOOG), Facebook (NASDAQ:FB) and Amazon (NASDAQ:AMZN) over the last 5 years, and the enormous wealth created for their shareholders since 2009, not to mention the new-found generation of Robinhood investors who thought maybe a 20% capital gains rate was ok, and might now be looking at a +30% rate, will the higher cap gains rate slow the mo-mo crowd that captivated the markets in 2020 ?
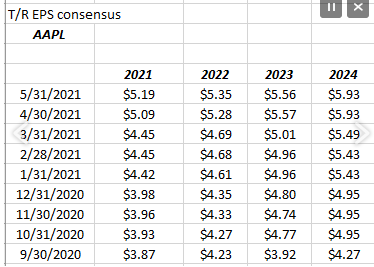
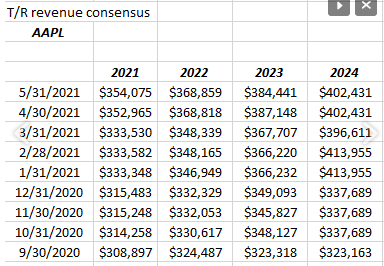
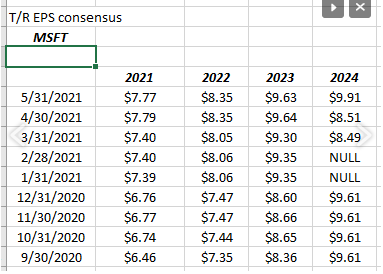
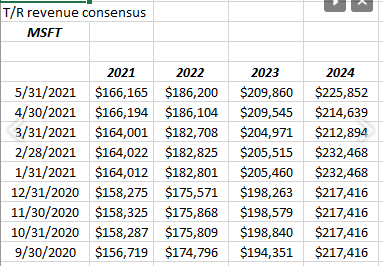
Let’s take a quick look at the EPS and revenue revisions for the Top 5 stocks in the SP 500 as of 5/31/21.
9/30/20 was used as the starting date for the consensus EPS and revenue estimates since the peak for the Top 5 in 2020 was at or near September 1, 2020.
Apple:
Data Source: IBES data by Refinitiv
Readers can see the sharply higher revisions over the last 2 quarters, and for 2021 (ends Sept. 30) and 2022 for both EPS and revenue, but note how 2023’s revenue estimate has started to roll over just a little bit.
Apple’s full-year 2021 and 2022 EPS estimate has risen 34% and 36% respectively just since 9/30/20 while the respective revenue estimates have risen 15% and 14% for the same years.
Apple is trading at 24x and 23x estimated 2021 and 2022 EPS for an expected average growth rate over 2021 and 2022 of 30%.
Readers can see that since the stock peaked in Sept ’20, the EPS and rev estimates have moved higher and the valuation has gotten cheaper.
Microsoft:
Data source: IBES data by Refinitiv
Microsoft continues to be a champ, even beating the S&P 500 YTD as of 5/31/21, +12.76% vs the SPY +12.71%.
The consensus EPS estimates for Microsoft have increased 20% since 9/30/20 for the 2021 estimate (fiscal year ends 6/30/21) while only increasing 13% for the 2022 fiscal year EPS estimate. The consensus revenue estimates for fiscal 2021 and 2022 have been revised 6% higher since 9/30/20, so a little more modest growth is expected.
Microsoft is trading at 32x a blend of 2021 and 2022 EPS with an “average” growth rate expected over the next 13 months of about 21%.
Amazon:
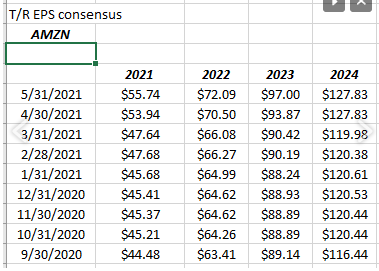
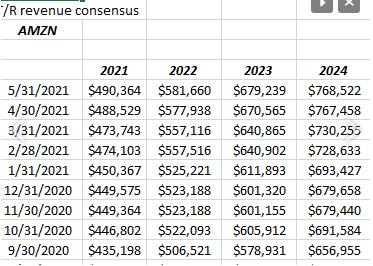
Source: IBES data by Refinitiv
Since 9/30/20, the 2021 and 2022 EPS estimates have increased by 25% and 14% respectively, while the revenue consensus for the same years is higher by 14% respectively for 2021 and 2022.
Amazon is trading at 50x EPS for an expected average growth rate in 2021 and 2022 of 26%.
What’s interesting about Amazon is that the company has had only one year below 20% growth in the last 19 years and that was 2014’s just 19% growth. Since 2003, Amazon have “averaged” 19% revenue growth every year through 2020.
Alphabet / Google:
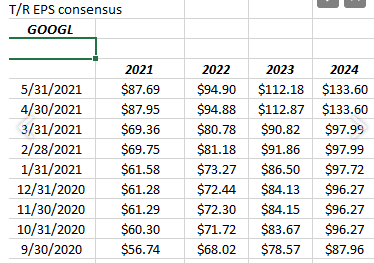
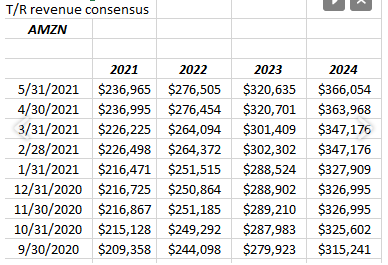
Data source: IBES data by Refinitiv (That ticker inset atop revenue consensus should read GOOGL and not AMZN.)
Personally, I found the upward revisions on Google shocking after their last two quarterly reports. Consensus EPS estimates for 2021 and 2022 increased 55% and 40% respectively over the two quarters from 9/30/20 while consensus revenue estimates increased 13% for each year.
The announcement of the $50 billion addition to the share repurchase program, undoubtedly helped.
Google is trading at a 25x multiple for an expected 29% EPS growth rate over the next two years.
Facebook:
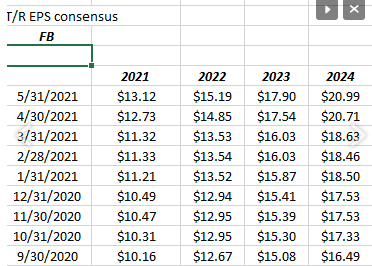
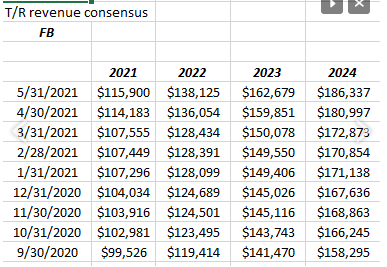
Source: IBES data by Refinitiv
Just since 9/30/20, Facebook’s 2021 and 2022 EPS estimates have been revised higher by 30% and 20% respectively, while consensus revenue estimates have been revised higher by 15% and 16% respectively.
Facebook is trading at 23x the combined 2021 and 2022 multiple for what is expected 23% growth over the next 18 months. It’s the only of the stocks mentioned here tonight that hasn’t seen its multiple contract below it’s growth rate, since September, 2020.
Summary / conclusion
The mega-cap S&P 500 stocks known as the Big 5 or whatever acronym you want to give them (I still think of them all as tech even though the SP 500 reclassified Amazon, Google and Facebook into different sectors several years ago), but what puzzles me is that – whatever sector you want to drop then into – they all stopped in their tracks in early September, 2020, so maybe we could say they are still closely correlated from a trading perspective ?
Ranked from largest to smallest here is their respective free-cash-flow generation over the trailing twelve months and that FCF multiple:
- Apple: $92 billion 23x
- Microsoft: $52 billion, 34x
- Alphabet (NASDAQ:GOOGL): $50 billion, 29x
- Facebook: $24 billion, 40x
- Amazon: $19 billion, 82x
That is $237 billion in free-cash-flow from the largest stocks in the S&P 500 on TTM basis.
The consensus is already expecting slower growth from all the names in 2022, which is a return to the normal earnings pattern.
Given the numbers it’s hard to want to trim the mega-cap names, but really they havent traded well even as the valuations have gotten cheaper. Only Facebook doesn’t have a PE that is lower than it’s expected 15 month EPS growth rate, which means the stocks are too cheap, or the EPS estimates are at risk of falling over the next 15 months.
The real test (in my opinion) will be when we start lapping the August – September, 2021 period and the mega-caps have traded within a range for the year.
