
Technically Speaking For The Week Of March 25-29
Summary
- The economic environment is softer.
- The bond market is rallying.
- Smaller cap indexes are in modest downtrends.
- Defensive sectors have strong charts.
- More aggressive sectors are in less strong technical.
Professionally, I'm both a lawyer and an analyst, which means I suffer twice-over from "on the other hand"-ism. So, here's the conclusion.
- The possibility of strong equity markets advances is being diminished by a softer economic backdrop, the bond market rally, and underlying market technicals.
- However, I'm not seeing a cataclysmic sell-off. Instead, I think a general meandering with a modest downside possibility as the most likely scenario.
Fundamental Backdrop
Here are the main points in bullet point format with links.
- The EU is experiencing softer growth. The manufacturing PMI is signaling a contraction; industrial production has declined in 7 of the last 12 months; while still positive, business confidence has been declining for the last year; inflation is softer and has yet to hit the ECB's 2% target; the ECB has not only publicly commented on general softness but has restarted a lending program to stimulate business lending.
- Japanese manufacturing PMI is now showing a mild contraction; Japanese exports recently dropped the most in 2 years due to trade issues; industrial production has declined in 8 of the last 12 months; despite tremendous financial stimulus, inflation is once again barely positive.
- China's manufacturing PMI is modestly negative; GDP growth is slowing; industrial profits are down; factory output is the weakest on record; auto sales are declining; the economy is still heavily dependent on debt financing.
- Leading U.S. economic indicators are softer; 1-unit building permits have been declining for the last year; the 4-weak moving average of initial unemployment claims bottomed in September; the yield curve has inverted modestly; the bellow of the curve has been inverted since the beginning of the year; retail sales have been growing at a slower pace.
The best way to describe this data is softer. The data has been in this trend for the last 6-8 months and it's global in nature. While I don't think a recession is imminent, it's an increasing possibility (see the links to Turning Points above to see that I've got the recession probability in the next 6-12 months at 30%). More importantly, for the markets, this means that earnings growth - the mother's milk of stock valuations - will be slower. Overall, the data is mildly bearish.
Technical Backdrop
The bond market is rallying. Ideally, the bond and stock markets should have an inverse relationship. When the economy is growing, we should see an increase in earnings, which fuels equity prices. At the same time, faster growth increases inflationary pressure, which is negative for bonds. The opposite theoretically holds true as well. While this is not how these two asset classes trade all the time, it does hold up in a general sense.
And, right now, the bond market is in the middle of a strong rally:
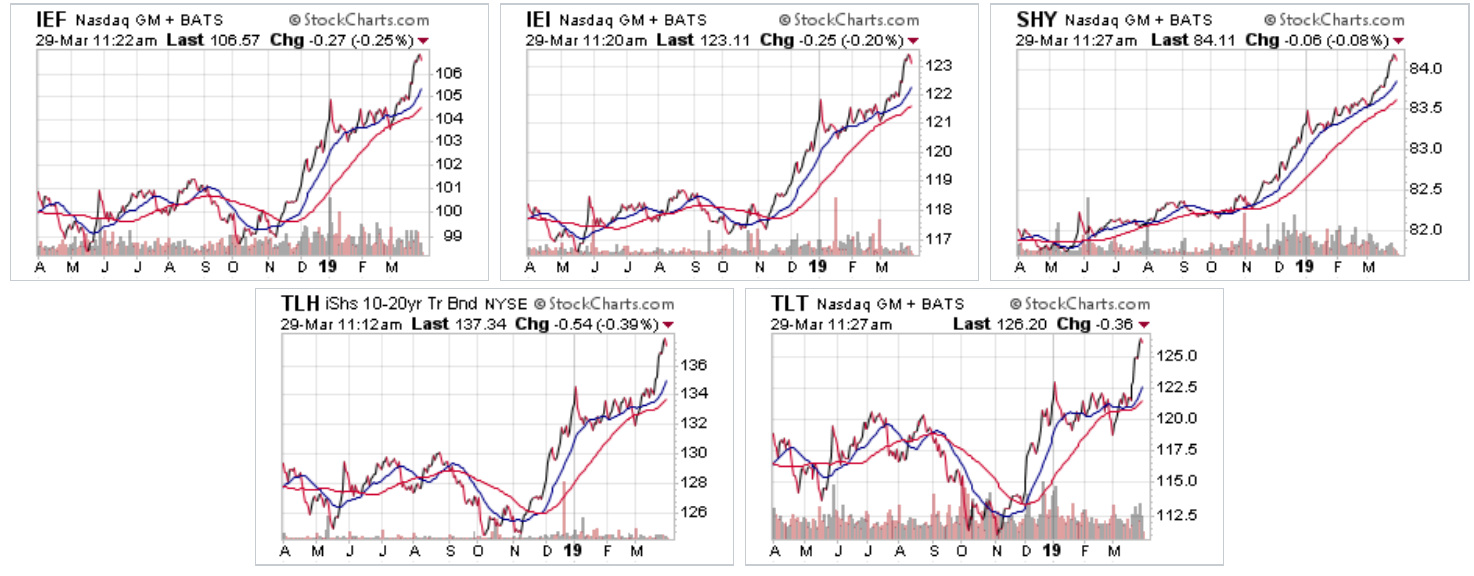
Above are 1-year charts of the major ETFs that track the U.S. Treasury market. All have been rallying since the 4Q18. This tells us that bond traders see weak inflation, which is another way of saying they see slow growth.
Two additional points:
- These are big moves by bond market standards. The IEF (7-10 year treasuries) is up 7% in 4-5 months. The TLT has rallied 12.5%.
- Fund flows are now pro-bond. Earlier Lisa Abramowicz tweeted this graph:
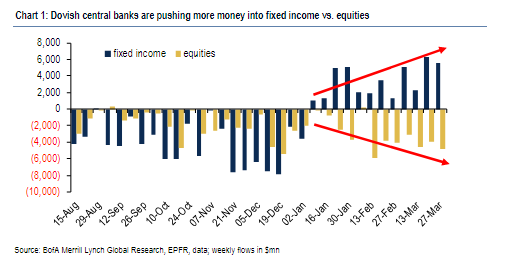
So, at least some market participants are betting on, at best, slower growth.
The latest rally isn't that impressive.
Smaller cap indexes are underperforming larger-cap indexes: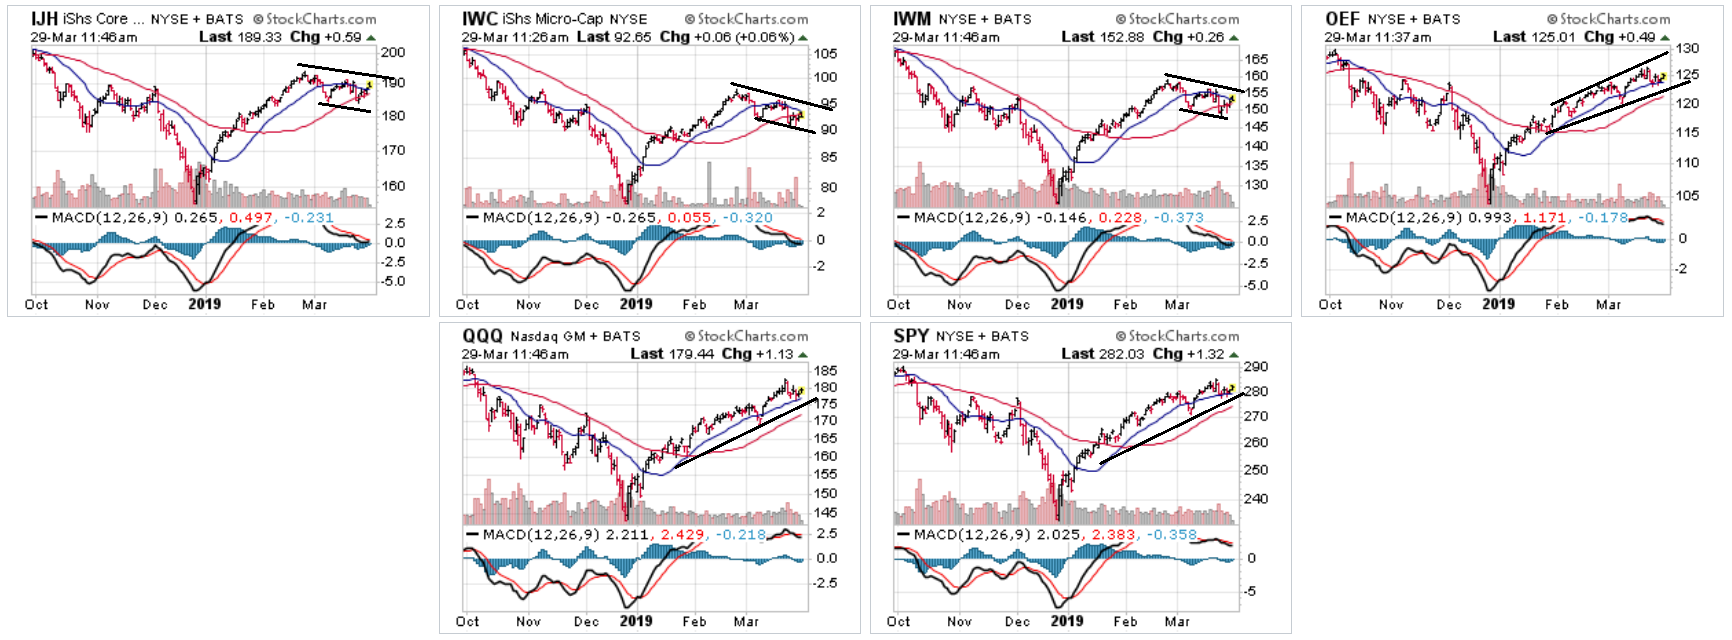
Mid-caps (top row, far left); micro caps (top row, second from left), and small caps (top row, second from right) are all trading slightly down since the first of the year with declining momentum (see the MACD below each chart). In contrast, larger-cap indexes (the remaining charts) are all in uptrends. This is very much a "risk-off" development and also looks like a "we see slower growth" trade pattern (smaller cap stocks need faster growth while larger caps - due to size and market penetration - can better weather slower growth).
Finally, the sector charts are modestly bearish.
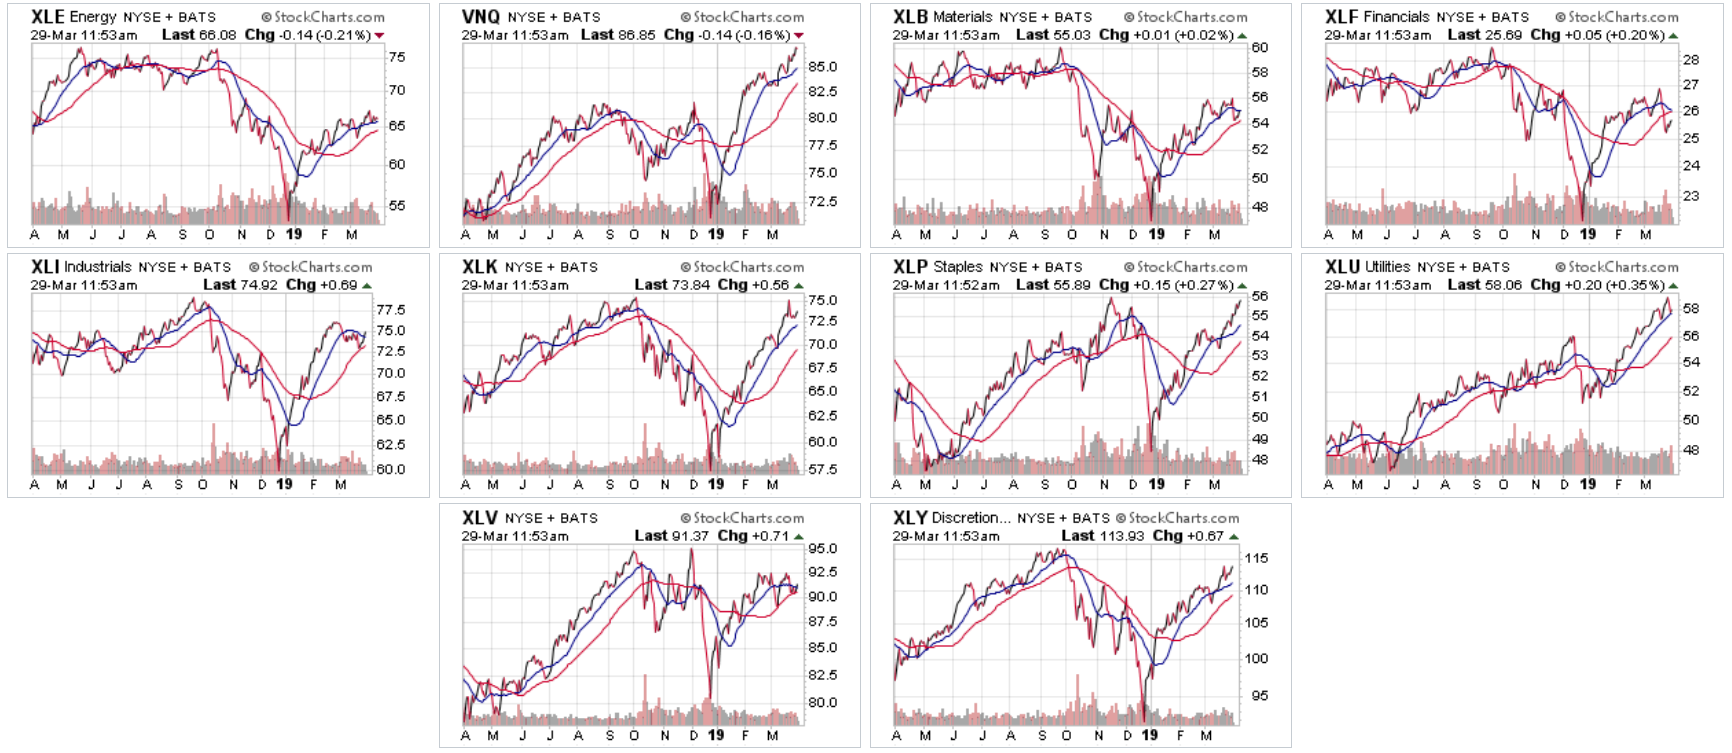 Three defensive sectors (real estate, top row, second from left; staples, second row, second from right, utilities, send row, far right) are in the middle of strong rallies. Financials (top row, far right), which are the third largest component of the SPYs (12.74%), are treading water due to interest rate cuts. Technology (middle row, second from left), which is the largest member of the SPY (21.22%) and a much larger percentage of the QQQ is very stretched technically. Healthcare (bottom row, left) is the third largest member of the SPY and a solidly defensive sector. But thanks to political issues (drug pricing, the re-boot of the ACA challenge) has a fair amount of headwinds.
Adding all this up, and you get a "toppy" market.
Disclosure: I/we have no positions in any stocks mentioned, and no plans to initiate any positions within the next 72 hours. I wrote this article myself, and it expresses my own opinions. I am not receiving compensation for it (other than from Seeking Alpha). I have no business relationship with any company whose stock is mentioned in this article.