Technically Speaking For The Week Of July 2-5
Summary
- International data continues to be soft.
- The RBA cut Australian rates; Friday's employment report probably took a rate cut off the table for now.
- Once again, large-caps are outperforming small caps.
International Data of Note
EU/UK/Canada
- EU
- EU manufacturing PMI 47.4.
- EU service PMI at 53.6
- EU composite PMI at 52.2
- EU retail sales down .3% M/M, up 1.3% Y/Y
- EU credit growth down marginally in May
- UK
- UK manufacturing at 48
- UK service at 50.2
- UK construction at 43
- Canada
- Canada PMI at 49.
EU/UK Conclusion: the data continues to be soft. EU manufacturing PMIs are very weak; new orders are contracting and confidence soft. The UK is getting hit by a post-Brexit vote slowdown: businesses had increased activity in anticipation of a hard Brexit which pulled orers forward. Now orders are weaker.
- Australia
- AIG (NYSE:AIG) Services at 52.2
- AIG Construction at 40.4
- Retail sales up .1%
- Trade balance up 19% SA
Please see discussion in central bank actions for the conclusion about Australia's economy.
Central Bank Actions
The Reserve Bank of Australia lowered rates 25 basis points. Here are key points from their policy announcement:(emphasis added)
The outlook for the global economy remains reasonable. However, the uncertainty generated by the trade and technology disputes is affecting investment and means that the risks to the global economy are tilted to the downside. ...
Consumption growth has been subdued, weighed down by a protracted period of low income growth and declining housing prices. ...
The central scenario for the Australian economy remains reasonable, with growth around trend expected. The main domestic uncertainty continues to be the outlook for consumption, although a pick-up in growth in household disposable income is expected to support spending.
The Australian economy is softer. GDP grew 1.8% in the latest report but the overall trend is lower since 2Q18; The unemployment rate has ticked higher since 4Q18 and is 5.2%; industrial production was up 1.2% (quarterly calculation) in the 1Q19 but its pace of increase has consistently declined since 2Q18. Retail sales are also softer -- they have been declining since October 2018 and grew 2.7% in the latest report. Australian growth has been dependant on two key events
- Chinese growth: Australia supplies raw materials to China's growth engine, which is largely capital spending. Australian investment in basic materials spiked after the GFC and has since some done.
- Australia real estate -- which grew due to international investment (Asian wealth sought out other areas of investment) and rising domestic prosperity.
Rising trade tensions and the natural transition to a more developed economy growth model are slowing the first area of growth, which is seeping into the second.
US Data of Note
The Institute of Supply Management released manufacturing and service sector reports this week. The manufacturing number decreased by .4 to 51.7. New orders were right at 50 -- the number that separates expansion and contraction. Production, however, increased 2.8 points to 54.1 while 12 of 18 industries expanded. The anecdotal comments were littered with negative comments about tariffs (emphasis added):
- “China tariffs and pending Mexico tariffs are wreaking havoc with supply chains and costs. The situation is crazy, driving a huge amount of work [and] costs, as well as potential supply disruptions.” (Computer & Electronic Products)
- “Tariffs are causing an increase in cost of goods, meaning U.S. consumers are paying more for products.” (Chemical Products)
- “Tariffs continue to be a challenge. We are concerned about the implementation of Mexican tariffs and the cost pressures it will have on our Latin American business.” (Petroleum & Coal Products)
- “Tariffs continue to adversely impact decisions and forecasting. Our increasing fear is that current trends will weaken the global economy, influencing our ability to grow in 2020 and beyond.” (Fabricated Metal Products)
The Service sector report was stronger. While it decreased by 1.8 points, the composite reading was a healthier 55.1. 16/18 industries increased. While production and new orders were lower (down 3 and 2.8, respectively), both are at healthy readings of 58.2 and 55.8, respectively. Once again, tariffs were mentioned in the anecdotal comments:
- “New residential sales are off the typical pace by 10 to 15 percent year over year. Tariffs are working their way through the system, raising costs on finished materials.
- “Waiting to see what new tariffs on Mexican steel will do to the market.” (Professional, Scientific & Technical Services)
- “The suppliers we do business with are ‘claiming tariffs’ to justify price increases. While some of these issues could be credible, it’s our opinion that this issue provides cover to increase margins, as few will detail the line-item impact.” (Management of Companies & Support Services)
- “Closely watching the Trump tariffs on China, which could significantly impact medical supplies.” (Health Care & Social Assistance)
The above data shows that the manufacturing/service sector split continues. Manufacturing is struggling due to increased international trade tensions while the service sector is growing at consistent rates.
The Census reported that construction spending is weaker (emphasis added):
Construction spending during May 2019 was estimated at a seasonally adjusted annual rate of $1,293.9 billion, 0.8 percent (±1.2 percent)* below the revised April estimate of $1,304.0 billion. The May figure is 2.3 percent (±1.5 percent) below the May 2018 estimate of $1,324.3 billion. During the first five months of this year, construction spending amounted to $498.8 billion, 0.3 percent (±1.3 percent)* below the $500.3billion for the same period in 2018.
Here are two charts of the data:
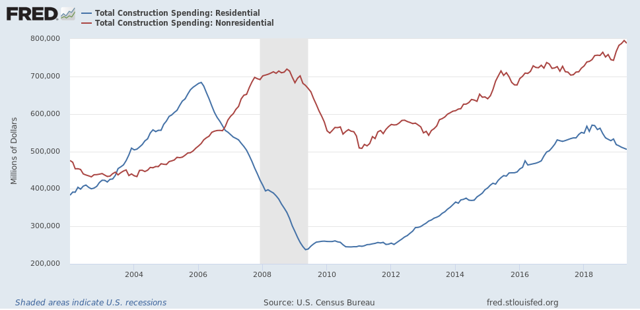
The above chart shows absolute numbers. Red tracks non-residential spending (61% of construction spending) which continues to increase; blue tracks residential spending (39% of construction spending) which has been decreasing since the beginning of 2018 (GDP data from the BEA also show this trend).
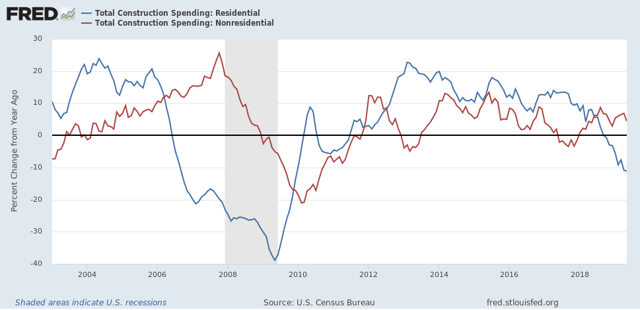
The above chart converts the absolute data into a Y/Y format; non-residential (in red) is now growing while residential (in blue) is decreasing.
Finally, on Friday, the BLS released the latest employment report:
Total nonfarm payroll employment increased by 224,000 in June, and the unemployment rate was little changed at 3.7 percent, the U.S. Bureau of Labor Statistics reported today. Notable job gains occurred in professional and business services, in health care, and in transportation and warehousing. ...
In June, average hourly earnings for all employees on private nonfarm payrolls rose by 6 cents to $27.90, following a 9-cent gain in May. Over the past 12 months, average hourly earnings have increased by 3.1 percent.
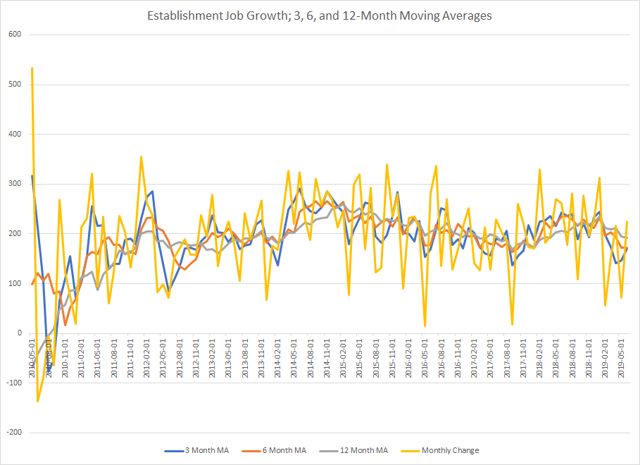
Here's a chart of the relevant data:
Data from the St. Louis Federal Reserve; author's calculations
To remove monthly noise, I've included 3, 6, and 12-month moving averages, which are currently at 171,000, 172,000, and 192,000. The 3-month average is moving higher while the latter two are moving lower. But all three are still at good levels.
An important note: the strong employment report probably put the Fed on the sidelines for now.
US Conclusion: overall, the data is good. Manufacturing data is softer due to increased international trade tensions. But -- the sector is still expanding. The service sector is in much better shape. And, since it is a much larger percentage of the economy, the possibility of a recession is a bit lower. Finally, companies are hiring at a strong clip.
US Market Overview
Here's the performance table for the week:
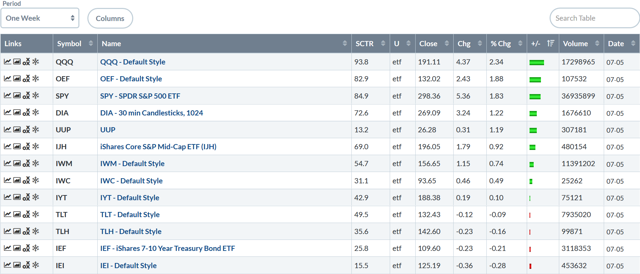
The equity indexes were up, with the QQQ leading the way. The OEF followed, with the SPY and DIA next. Then we have the mid, small, and micro caps, all of which gained but to a smaller degree than the large-caps. The treasury market sold-off fractionally.
The 30-day charts show the overall trend of the large and smaller-cap indexes. Let's start with the OEF:
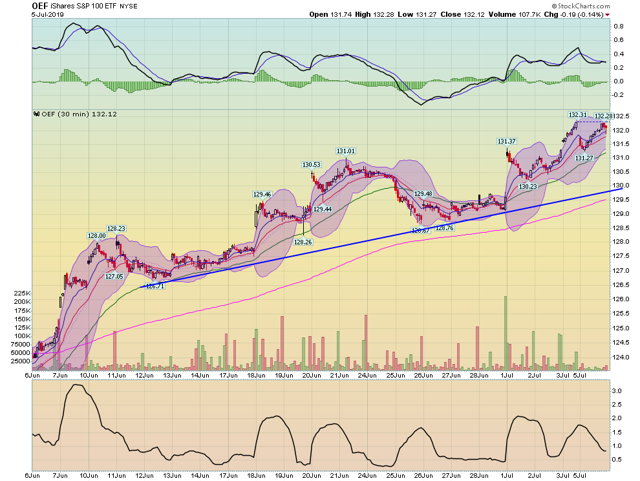
Starting on June 13, the OEF started to move higher and has been in an uptrend since. The index has gained about five points during that time.
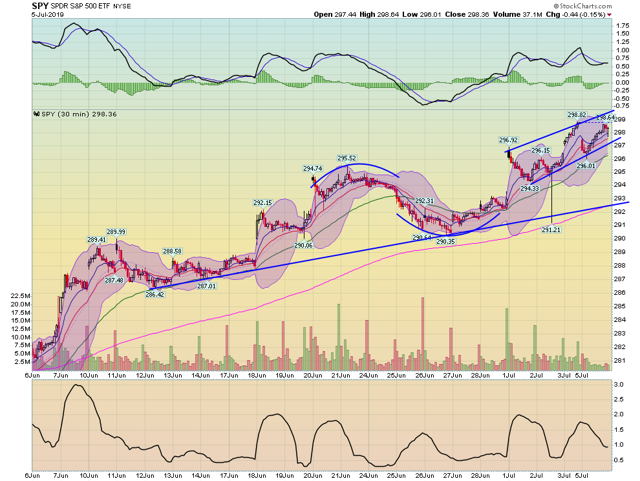
The SPY has the exact same pattern, as does ...
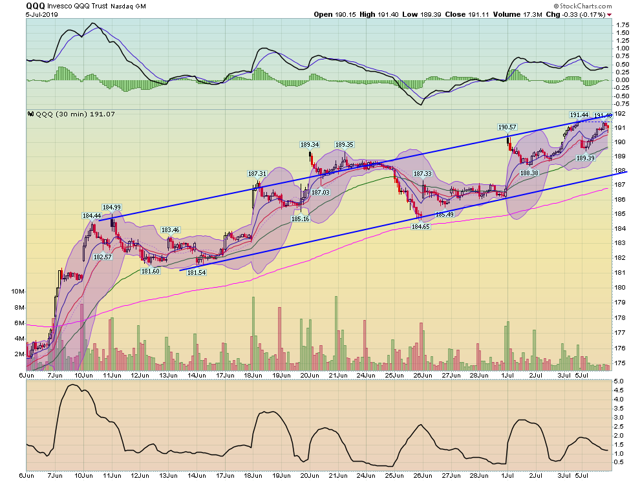
... the QQQ.
Then we have the smaller-cap indexes, with a very different chart:
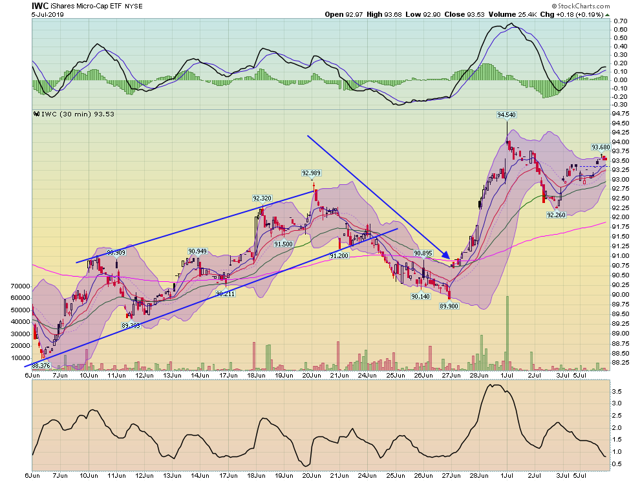
Micro-caps started to rally on June 6. But they sold-off starting on June 21 and rebounded at the end of June. For July, the index has more-or-less moved sideways, which is the exact same pattern ...
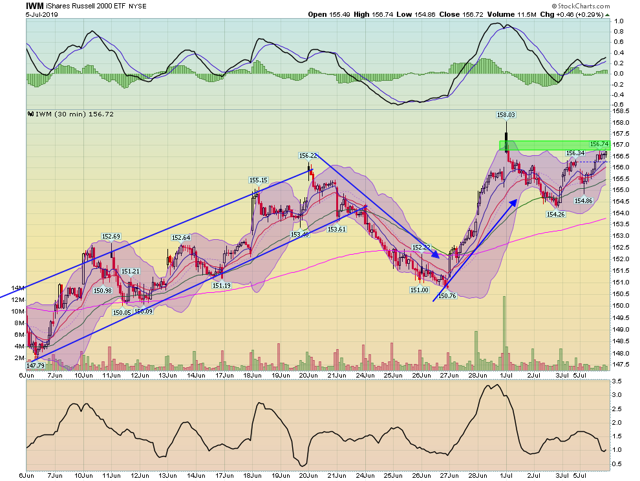
... as the small caps ...
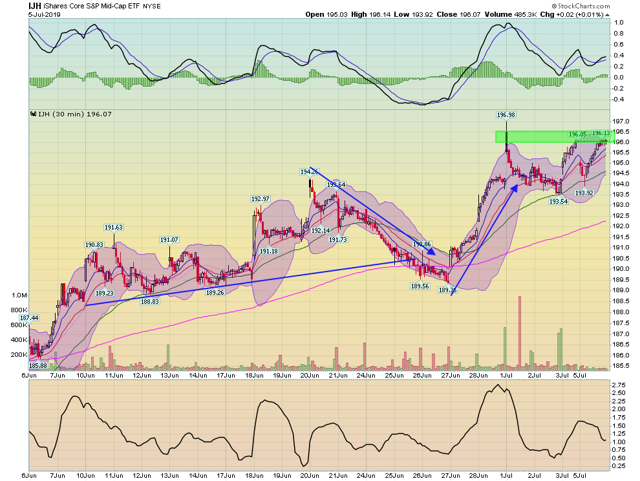
... and mid-caps.
So, where does all this leave us? Where we've been for most of the Spring -- a standard, end-of-the-cycle rally. Large-caps and treasuries are outperforming small caps. Skew your holdings to large-caps and longer-dated bonds and think about downside protection in the event a negative event sends the markets lower.

