Technically Speaking For May 5-9
Summary
- Internationally, things are fair; while it appears China has bottomed, the EU is still weak and the anecdotal information points to weak trade.
- US data was positive.
- The markets were down on the week and internals are weaker.
Economic Releases of Note
Asia
China
- China composite PMI 50-52.7
- Chinese exports down 2.7%
- Chinese CPI up 2.5% Y/Y
- Chinese loans up 13.3% Y/Y
Japan
- Japan composite PMI 50.4-50.8
Australia
- Australia Construction PMI down 3 points to 42.6
- Australian trade surplus increased
- Australian retail sales up .3% M/M
Asia Conclusion: it continues to appear that last year's Chinese stimulus measures have engineered a soft landing. The PMI reading was positive, loans are increasing, and prices are rising a bit. However, there are still reports in the other Asia PMI releases indicating export demand is soft.
EU/UK/Canada
- EU composite PMI 51.6-51.5
- Italy composite drops from 51.5-49.5
- France composite increased 48.9-50.1
- Germany composite rises from 51.4-52.2
- Spain's composite down to 52.9
- EU Retail sales unchanged M/M
Canada
- Canada Ivey PMI at 55.9
- Canada housing starts up strongly
EU Conclusion: the data and sentiment remain just north of the line between expansion and contraction. The biggest concern remains the weakness in exports; all the PMI data indicated that external demand was soft
- EM
- Brazil composite PMI down from 53.1-50.6
- Argentina IP down 13.4% Y/Y
- Mexican gross fixed capital investment down 2.5% M/M
- Russian inflation up to 5.3%
EM Conclusion: there was insufficient data to make a conclusion.
US Data of Note
This was a light week of data, which started with the JOLTs release on Tuesday. Here's a chart of the relevant data:
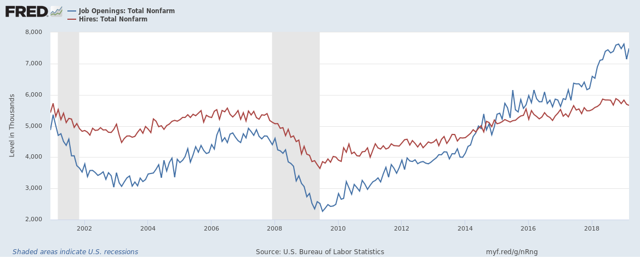
The blue line represents total openings while the red line represents hires. Starting in 1H14, there were more openings than hires, a positive development. There are a number of potential reasons for this development: mismatching of demand and supply (a fairly consistent theme in the anecdotal reports), a decline in the number of people participating in the labor force (caused by both increasing retirements and people physically leaving the jobs market), and geographic issues related to the data. Regardless of the reasons, this indicates the jobs market is healthy.
The BLS released two price reports this week, starting with the producer price index. Here's the key table from the latest report:
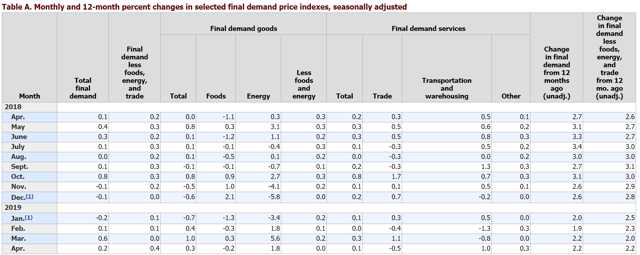
The columns on the right (overall PPI; second from right and core PPI; far right) contain the key data. Both have trended towards 2% over the last five months, indicating declining price pressures for manufacturers.
Here's a chart of the relevant CPI data:
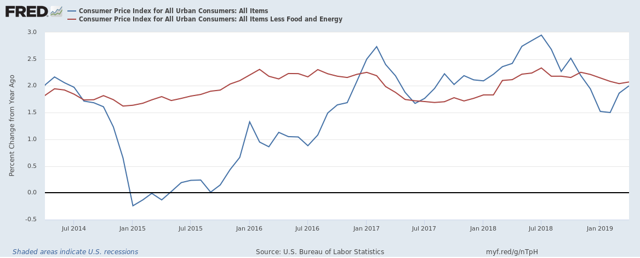
Core (in red) has been just above 2% since 2Q18. Total CPI spiked to just under 3% last summer but has since trended below 2%. It's risen in the last few readings but is clearly contained.
The combined reading of the price data is that the Federal Reserve has little to be worried about on the inflation front.
US data conclusion: there is insufficient information to draw a conclusion about the health of the US economy. But in my Turning Points Newsletter, I have maintained my 15% recession probability in the next 6-12 month, largely based on the narrow yield curve.
Central Bank Actions of Note
The RBA maintained Australian rates at 1.5%. Here is their outlook for the Australian economy (emphasis added):
The central scenario is for the Australian economy to grow by around 2¾ per cent in 2019 and 2020. This outlook is supported by increased investment in infrastructure and a pick-up in activity in the resources sector, partly in response to an increase in the prices of Australia's exports. The main domestic uncertainty continues to be the outlook for household consumption, which is being affected by a protracted period of low income growth and declining housing prices. Some pick-up in growth in household disposable income is expected and this should support consumption.
The Austrian economy hasn't had a recession in over 20 years but the reason is its symbiotic relationship with China: Australia provides the raw materials for China's capital expenditures; whenever China increases spending, Australia benefits. The Australian economy is recovering from two imbalances: a massive increase in raw material extraction infrastructure spending (to take advantage of the Chinese relationship) and overspending on housing investment (which was largely caused by Asian investors looking for non-Chinese investment assets).
The Central Bank of Brazil maintained rates at 6.5%. Brazilian inflation is currently fluctuating between 4%-5%. Growth has been disappointing; in the last 12 quarters, the strongest annual growth rate was a paltry 2.2%. Manufacturing sentiment dipped below 50% in the latest reading, where is spent the first half of 2018. Unemployment has spiked to 12.7%. The overall situation is concerning and explains the latest election result.
US Markets
At the end of last week, the markets were at a crossroads. The large-cap indexes had led the markets higher since the beginning of the year. Micro and small caps had languished; mid-caps were performing modestly well. It appears that the small and micro-caps were on the cusp of a meaningful rally last Friday. Sunday's trade news burst that bubble, sending the markets lower on the week.
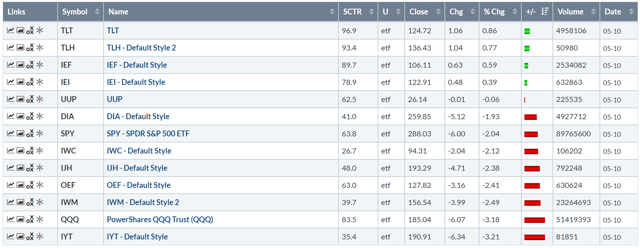
This is a standard flight to safety. The Treasury market rallied, with the long-end of the curve leading the way. At the bottom of the table are the transports, QQQ, and IWM. Still, the sell-off is hardly fatal: the transports are down 3.21% -- not much of a move lower.
Let's jump to this week's charts, starting with the treasury market ETF:
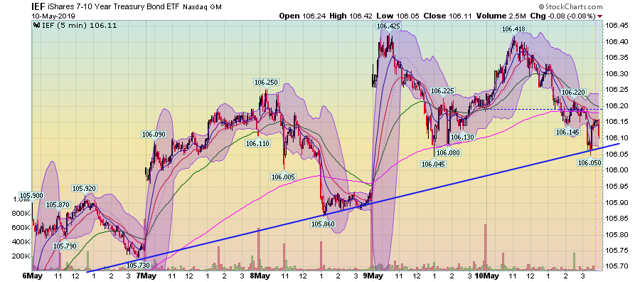
The IEF was in an uptrend all week, with a trend-line connecting the lows on Monday, late Wednesday, and Friday's close. The total move was small but that's to be expected in this market.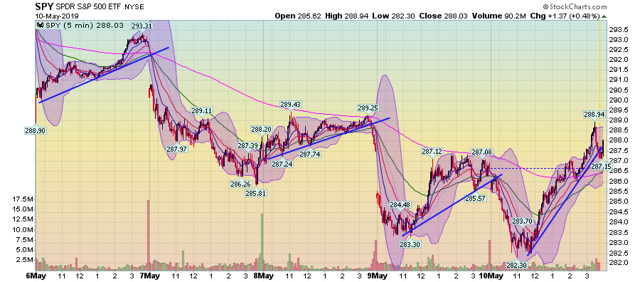
There's a fair amount of bearishness on this week's SPY (NYSE:SPY) chart. There are two gaps lower and the overall trend was down. But there are four separate rallies, indicating the bulls were clearly out bargain hunting. Finally, Friday's rally was particularly impressive. After forming a double-bottom in the late morning, prices rallied 1.75%, closing up on the day. Considering the depth of the bearishness, that's impressive.
However, the market internals for the large caps are concerning. Let's start with the SPY:
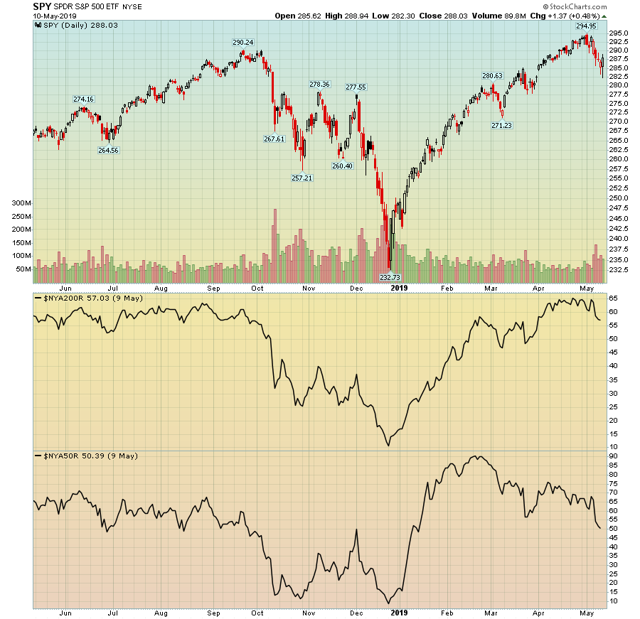
Pay attention to the two panels at the bottom. The top panel shows the percentage of stocks above the 200-day EMA; the bottom panel shows the percentage of stocks above the 50-day EMA. Despite the market rally, the percentage of stocks above their respective 50-day EMA has been declining. This means that a smaller number of companies are pulling the market higher.
We see the exact same pattern in the QQQ's numbers:
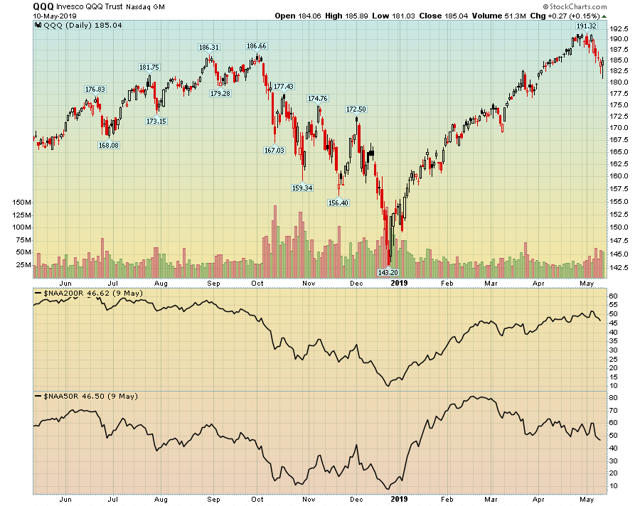
The good news is that the markets clearly think the trade war issues won't sink the economy. But the market breadth means the underneath the surface, the structure holding up this rally is getting thinner and thinner.
Disclosure: I/we have no positions in any stocks mentioned, and no plans to initiate any positions within the next 72 hours. I wrote this article myself, and it expresses my own opinions. I am not receiving compensation for it (other than from Seeking Alpha). I have no business relationship with any company whose stock is mentioned in this article.
