Technically Speaking For July 22Summary
- It looks like we might have a debt-limit deal.
- Don't forget that Brexit is still on the horizon.
- The short-term charts argue for a modest pull-back.
The White House and Congress are nearing a debt-limit deal:
House Speaker Nancy Pelosi (D-Calif.) and Treasury Secretary Steven Mnuchin have reached a "near-final agreement" on a two-year budget deal, according to a source close to the talks.
The emerging deal includes an increase in top-line defense and nondefense spending numbers for the 2020 and 2021 fiscal years, which are used to craft government funding bills. It would also suspend the debt limit until July 31, 2021.
This would be a welcome development. The last thing we need is another government shutdown, especially when increased trade tensions and Brexit are already adding stress to the financial markets.
Trump's Fed nominee is advocating for a 50 basis point rate cut:
Judy Shelton, President Trump’s intended nominee to fill an open seat on the Federal Reserve Board, is calling for a large interest-rate cut at the Fed’s July meeting.
When asked whether she would support reducing interest rates by half a percentage point in July, Shelton said she would and indicated she would have voted for that size of a cut in June had she been on the Fed board.
“I would have voted for a 50-basis-point cut at the June meeting,” she said in an email.
Her argument is based on the idea that other countries (such as Japan and the EU) have far lower rates. While they do, that does not mean the US should cut rates to match. US growth is in decent shape. And our rates -- while higher -- are hardly growth-prohibitive. Finally, a 50 basis point cut should be reserved for a true economic crash -- not as a way to achieve interest rate parity with other countries.
Remember that Brexit is still on the horizon and is a major risk to the global economy. There have been a number of stories over the last few weeks handicapping the UK Prime Minister battle, with Boris Johnson being the favorite. Remember -- he's all-in for a hard Brexit, which means that the UK would be in the EU on day X and out of the EU on day X+1. There is still a group of Tories who are just fine with the hard Brexit idea, even though it's a situation that has "law of unintended consequences" written all over it.
Let's turn to today's performance tables:
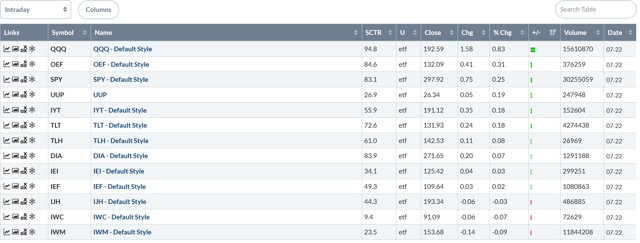
Once again, large-caps are outperforming small-caps. QQQs, OEFs, and SPYs were all higher. The QQQ had the strongest gain by far, rising 0.83. The OEF's performance was less than half that: 0.31. The small-cap indexes (IJH, IWC, and IWM) were all lower.
The sector performance table is mixed:

The good news is aggressive sectors rallied: the XLK, XLE, and XLF were all higher. And defensive sectors underperformed. The bad news is that 5/10 sectors rallied, which is overall bearish.
The 1-day charts of the IWM and QQQ illustrate the performance divergence.
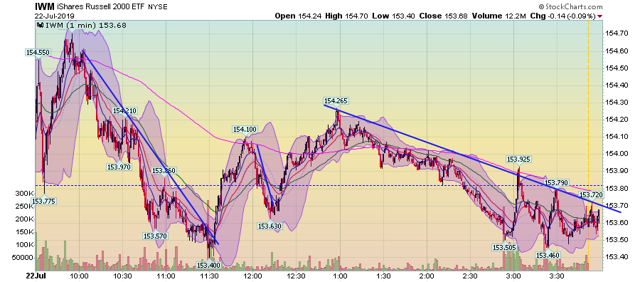
The IWM was lower on the day and couldn't maintain a rally. Prices popped at the open but fell until the late morning. They attempted another rally over the lunch hour only to retreat again. And after rallying until 1:00PM, they spent the rest of the day slowly selling off.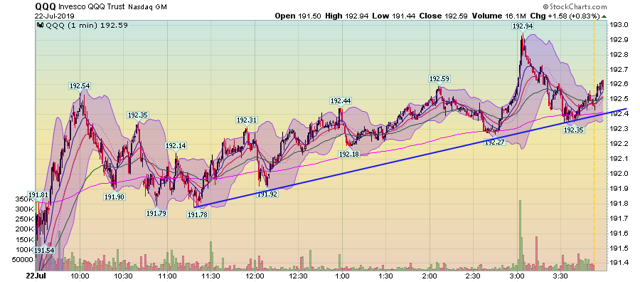
The QQQ, on the other hand, spent most of the day moving modestly higher, with a trend line connecting lows from the late morning and afternoon. Also note the series of successive highs that started in the late morning, culminating with the spike to 192.94.
Pullling back to the 30-day chart, it appears the markets are gearing up for a modest pullback:
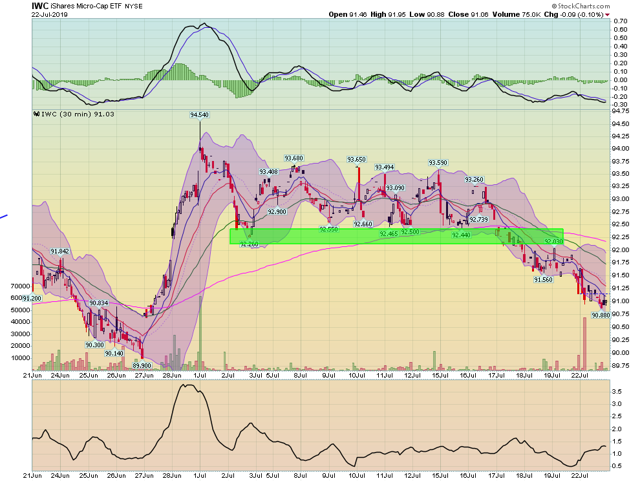
After consolidating between 92.25-93.5, micro-caps have broken support and are headed modestly lower.
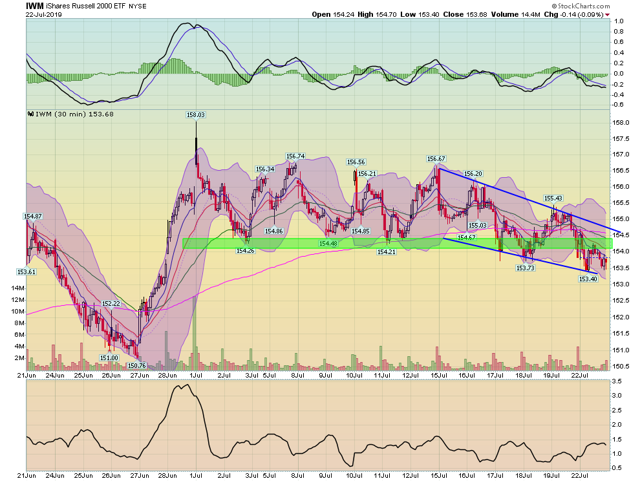
Small-caps had done the same.
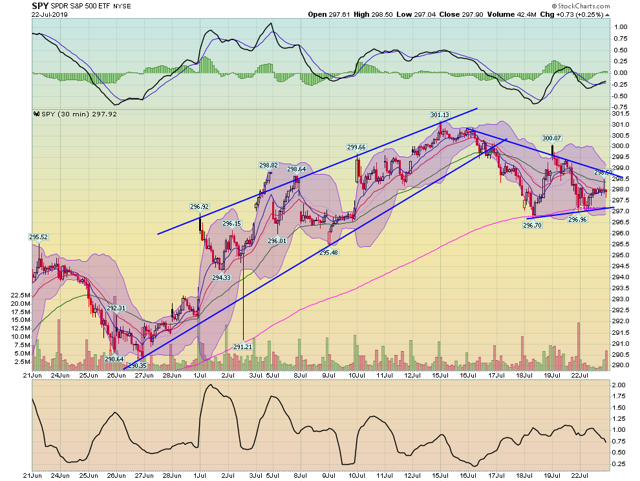
The SPYs have already broken support and are consolidating in a triangle pattern right above the 200-minute EMA.
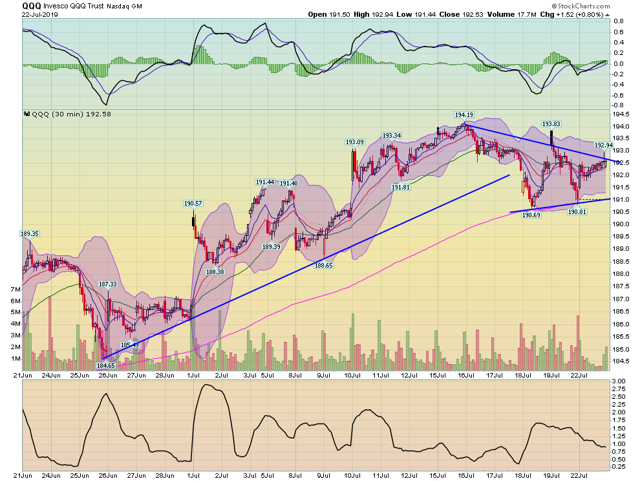
The QQQ broke trend in the middle of last week.
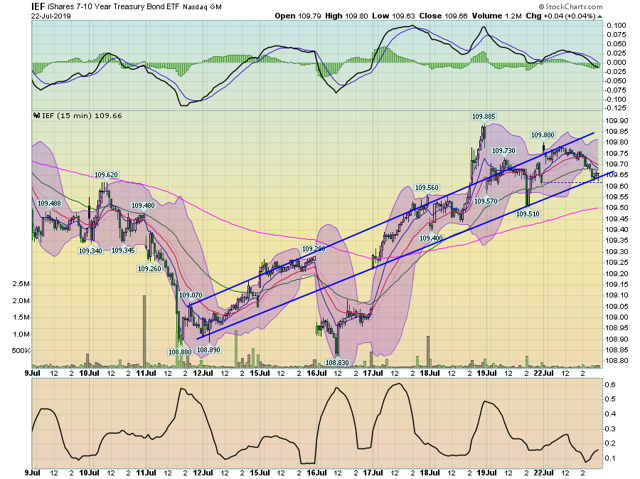
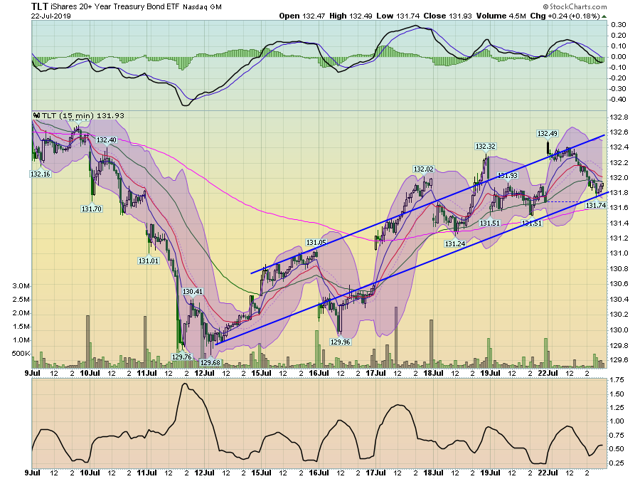
And the Treasury market has caught a short-term bid:
Both the IEF and TLT are in the middle of short-term rallies on the 2-week charts.
Because we're in the middle of the summer, don't expect a major pull-back if it does come. Also remember all of this is occurring in the context of a slow-motion topping pattern, which would limit the upside to any counter-rally.

