Summary- Brexit may not be dead, but recent events may be the beginning of the end.
- Recent sentiment indicator movements have been somewhat better.
- The markets barely moved today; we continue to see modest deterioration in several time frames, especially the daily charts.
Is Brexit dead? Not yet. But the possibility of a hard Brexit is certainly lower. Yesterday, Teresa May promised that she would allow a vote to delay Brexit. This isn't a permanent deferment; under EU rules, all EU countries would have to agree to an extension beyond July, which means that for now, all we have is a three-month delay. But the combination of threatened Tory defections by pro-EU members and Labour's embrace of a potential second Brexit vote may signal the beginning of a reversal of Brexit. This would be welcome news; the risk of a hard Brexit has hung over the global economy for far too long.
Good news on sentiment: The Conference Board's consumer sentiment index rebounded nearly 10 points in the latest report. The two latest EU sentiment reports contained a modest change from the previous month -- although the numbers are still low. Regarding the former, the quick rise could indicate that the government shutdown negatively impacted sentiment. The latter could indicate that the year-long decline is done for now -- a possibility that would be bolstered by a tamping down of Brexit concerns.
The San Francisco Fed has issued a policy brief on the yield curve and recessions. Here's the conclusion (emphasis added):
Overall, the current shape of the yield curve is somewhat worrisome. It has flattened substantially, making a possible future inversion more likely, and it is sending conflicting messages in that some parts of the curve now slope downward. But it is important to note that the yield curve is not fully inverted, and our preferred spread measure remains positive. Indeed, a yield curve flattening usually accompanies a period of monetary policy tightening—when the Fed raises its policy rate. Overall, before we see a clear inversion of the yield curve, it is too early to predict a recession in the near future.
This is technically correct, but it misses a key point. The yield curve is far more slow-moving than the equity markets. While a primary reason for the curve's inversion (Fed rate hikes) is on pause, the long-end of the curve still sees slower growth, which should keep longer yields low. And we're still seeing inversions in the belly of the curve.
The markets barely moved. The long-end of the Treasury market made the biggest move; it was off slightly more than 1%. On the other side, the micro and small caps were the best performers; the former was up .21% while the latter rose .13%. Larger company indexes were near unchanged.
However, the charts are still concerning.
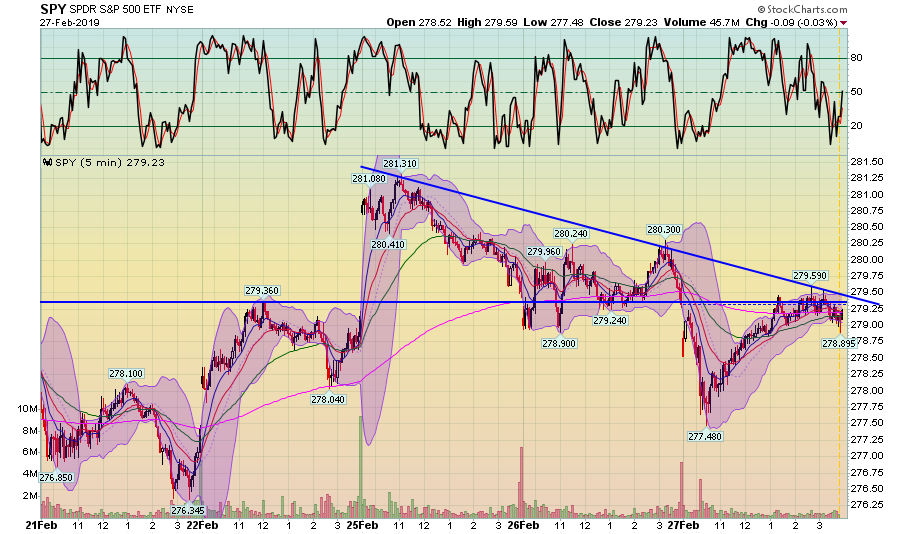
The SPY has a modest downtrend over the last three days. Prices are only down a few points, but they continue to print lower highs. Today, it could get meaningfully above the 200-day EMA while also hitting resistance at the 279-280 level.
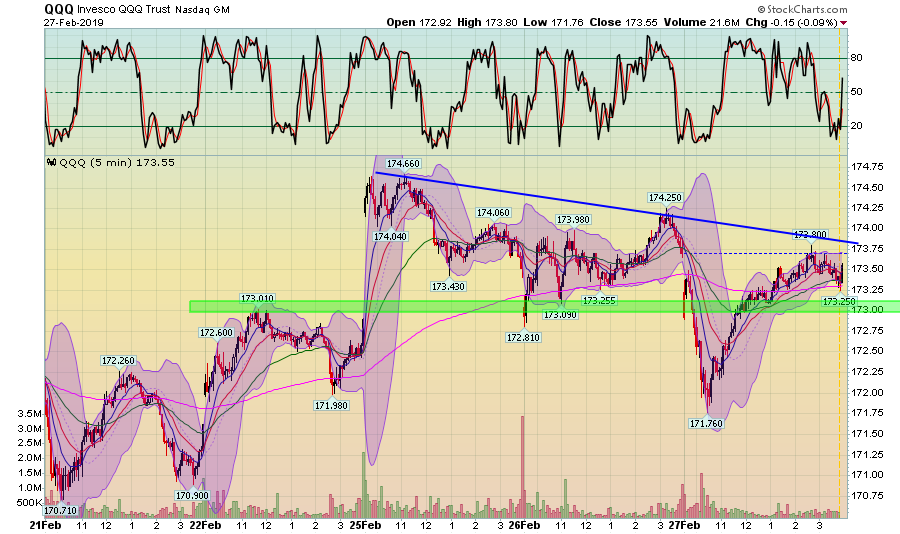
The Nasdaq is also printing a series of lower highs, although the index is slightly above the 173 level.
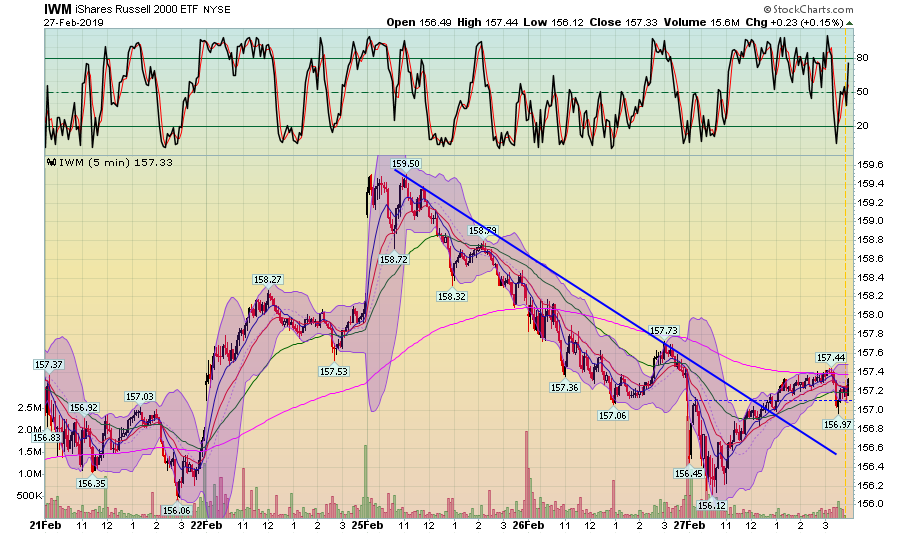
Small caps have declined in a sharper manner. While they broke the recent downtrend, they hit resistance at the 20-minute EMA before moving lower.
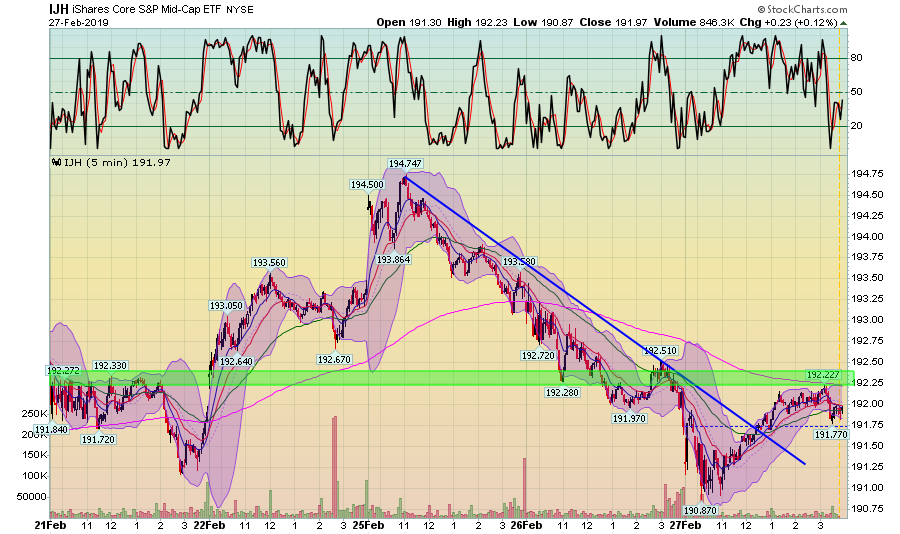
The mid caps have the same problem -- a fairly sharp sell-off combined with resistance at the 200-day EMA.
As for the charts of the major sectors, there are no bullish charts in the 5-minute/1-week time frame. Energy is the best:
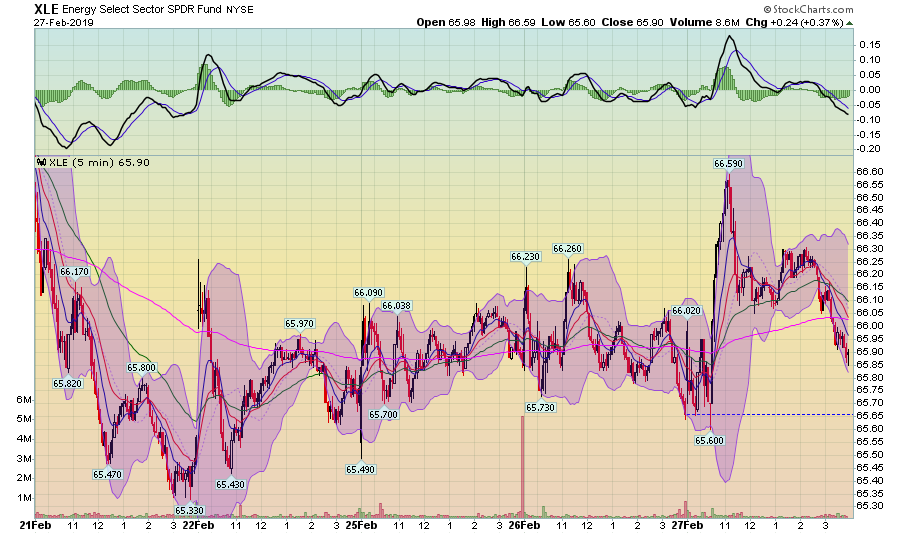
It has a very slight upward bias. But it's really trading more or less around the 200-minute EMA.
And two conservative sectors (staples and healthcare) ...
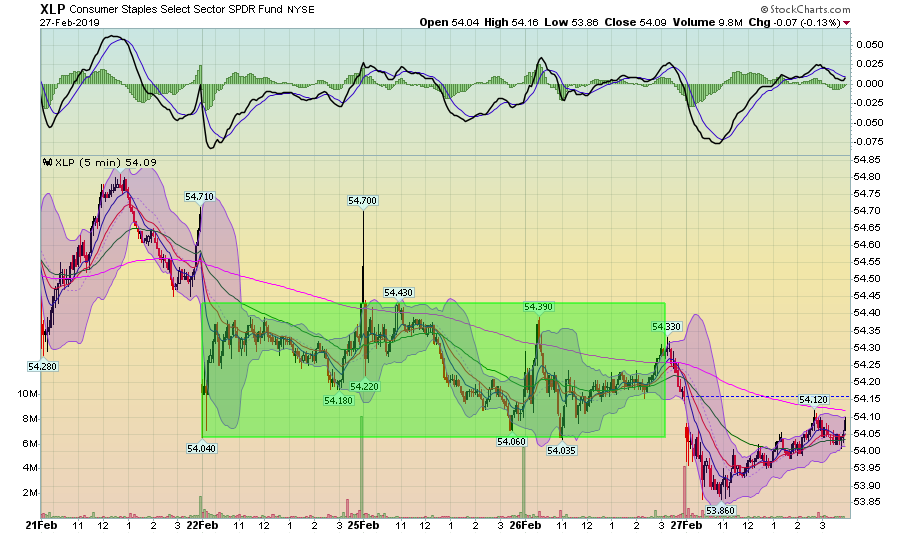
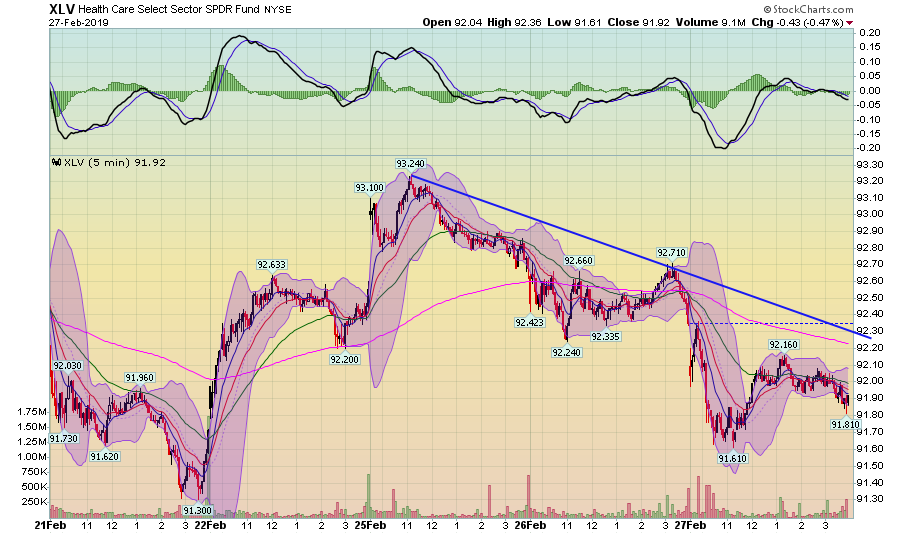
... are in shorter down-trends.
Finally, the daily charts are inching towards giving short-term sell signals.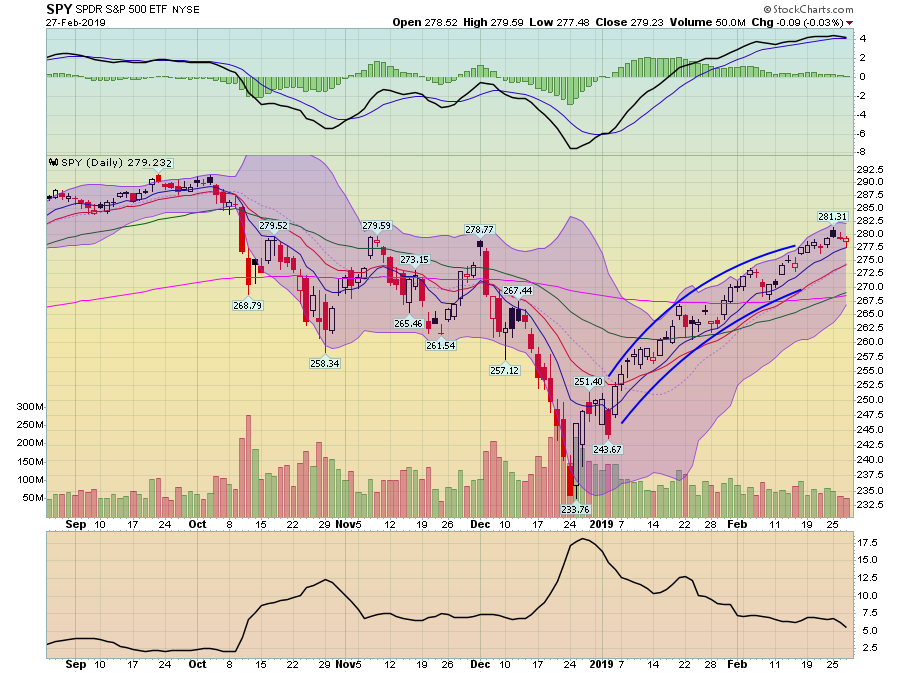
The SPY is trading near the top of its recent trading channel. But the MACD continues to flatten with the MACD about to give a sell signal.
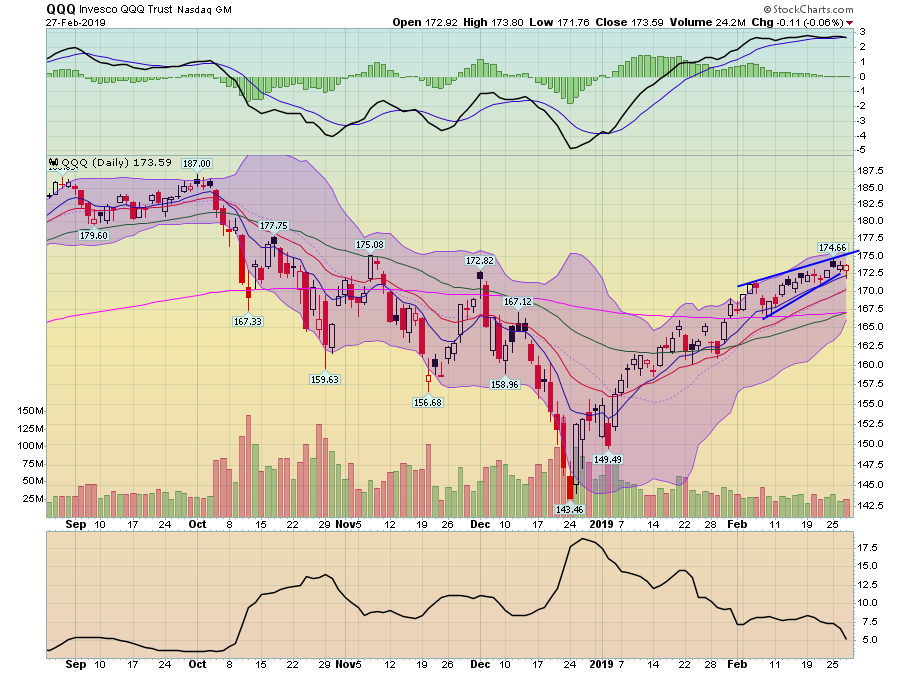
The QQQ's MACD has already given a sell signal, although it's a weak one. Ideally, we'd like to see a sharper trend break.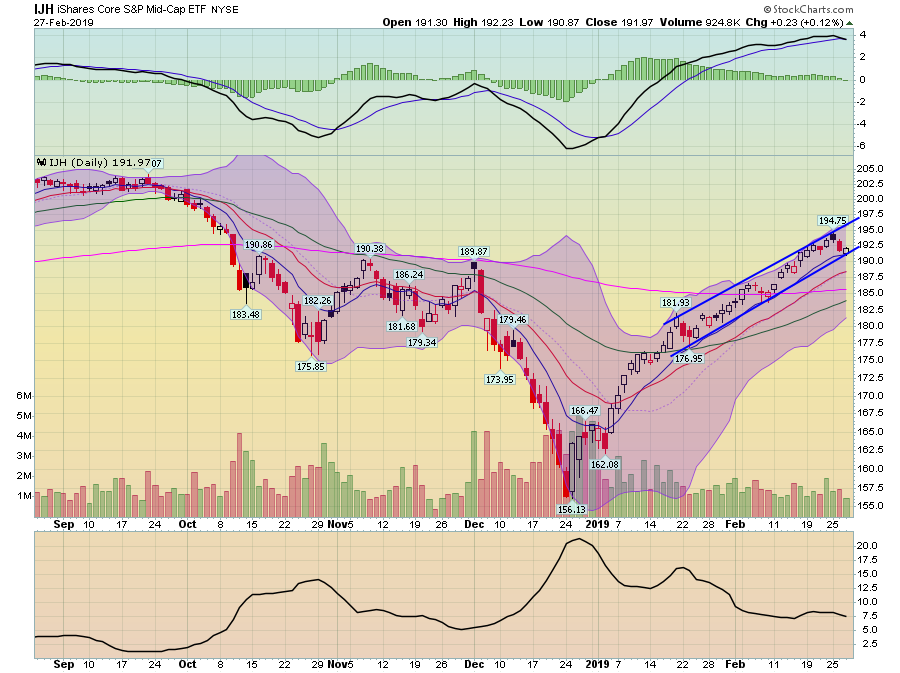
The mid caps are trading at the bottom end of their recent trading range; the MACD is also given a sell signal.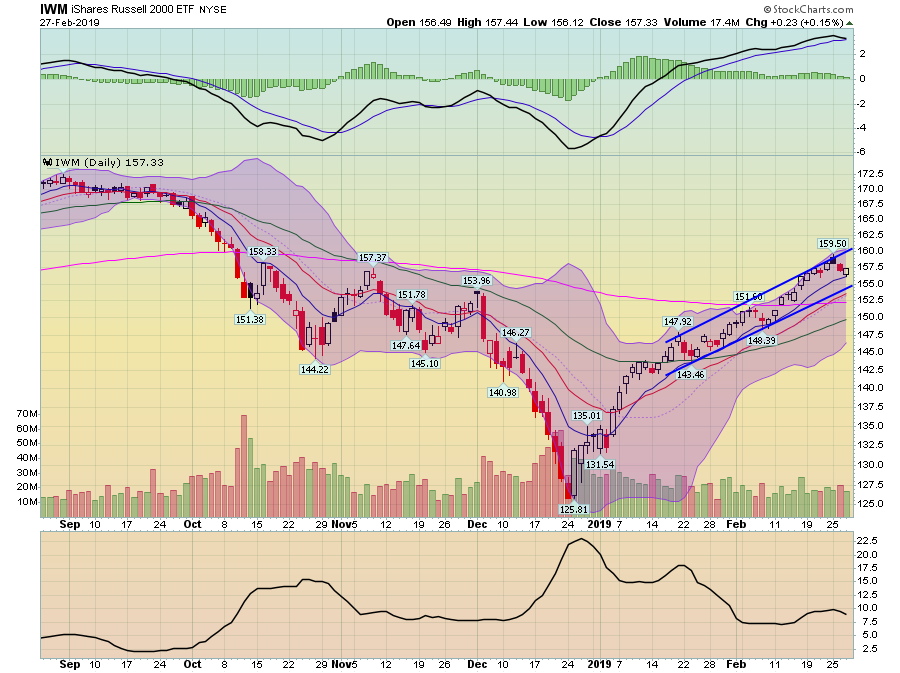
The IWM's daily chart has also given a sell signal.
Halfway through the week, it's feeling more and more like the markets are slowly turning, getting ready for a correction.
Disclosure: I/we have no positions in any stocks mentioned, and no plans to initiate any positions within the next 72 hours. I wrote this article myself, and it expresses my own opinions. I am not receiving compensation for it (other than from Seeking Alpha). I have no business relationship with any company whose stock is mentioned in this article.
