Last week, we discussed investors throwing caution to the wind and the need to take on defensive positioning. One week later, the bulls and bears are squaring off at the 200-DMA line to see who will gain control.
Over the last several weeks, we have repeated one simple phrase:
“Reversions happen fast.”
In last Tuesday’s “Technical Update”, we specifically noted the rather extreme overbought condition of the market. To wit:
“The number of sectors and markets which are trading at extreme overbought levels confirms this extension. The chart below shows a market rarity. Every sector and market, except for bonds, is extremely overbought.”
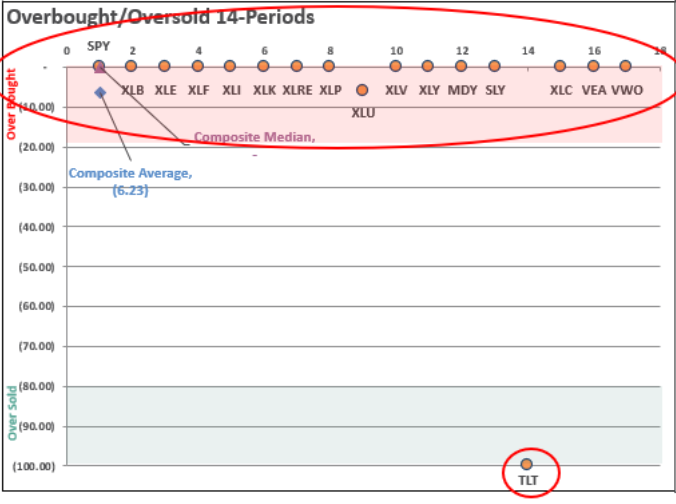
“The last time this happened was in the second week of April, which preceded a 4% correction, and then resolved itself in a month-long consolidation. The next good entry point came in mid-May. The price level was relatively unchanged, and the risk/reward for adding risk exposure was much improved.”
Risk vs. Reward
Just like the last time, it didn’t take long for the “correction” to surface. As noted previously, the correction quickly reduced the previous negative risk-reward parameters.
“That correction came swiftly on Thursday. The surge in COVID-19 cases in the U.S. undermined the “V-Shaped” economic recovery meme. As we noted, the market had rallied into overhead resistance, and the correction found support at the 200-dma.”
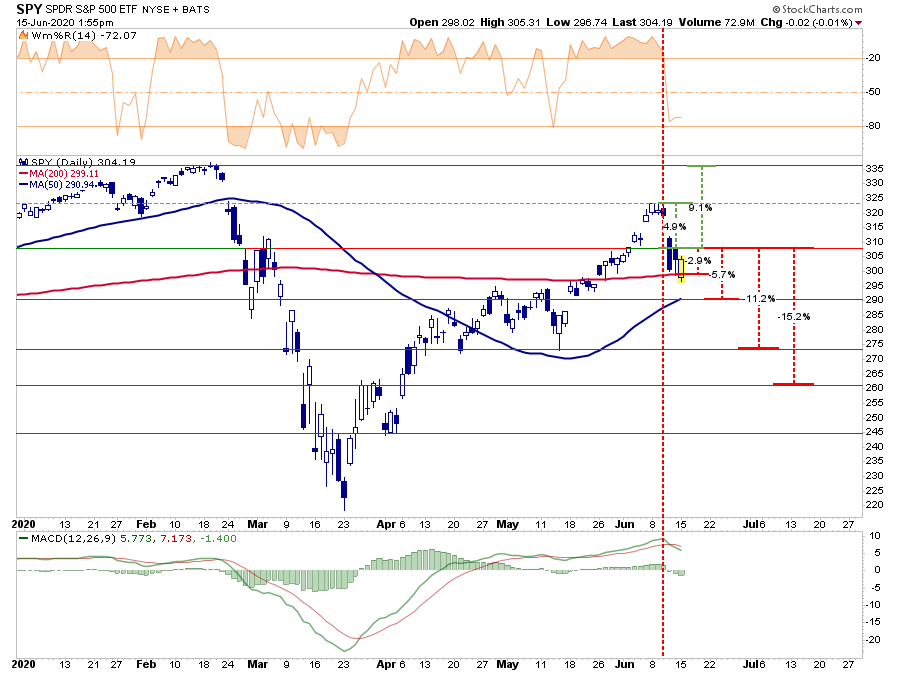
When the market had reached its peak two weeks ago, we penned a 70% probability that the market would correct the 200-dma. Last Thursday, that level was achieved. Currently, risk/reward parameters have improved somewhat due to the correction, but remain negative overall.
- -6.6% to the 200-dma vs. +5% to all-time highs. Negative (70% – Target achieved)
- -11.2% to the 50-dma vs. +5% to all-time highs. Negative (20%)
- -14.4% to previous consolidation lows vs. +5% to all-time highs. Negative (5%)
- -18.3% to March bounce peak vs. +5% to all-time highs. Negative (5%)
Importantly, the sell-off last Thursday was a good reminder of just how brutal markets can be when there is a complete lack of liquidity. It was also a good reminder of why we hedge our portfolios against just such an event.
Bulls & Bears Clash At The Line
On Monday, the bulls and bears fought over the 200-dma. It seemed at the open as if the bears were close to taking control of the market. However, the tide quickly turned. With markets plunging again at the open, and with Jerome Powell’s personal fortune on the line at Blackrock, the Fed took quick action:
Here is the aptly timed press release putting causing bulls to “rush back in:”
The Fed’s announcement was unnecessary as it only repeated the original mission of the SMCCF. The made made no changes to the program, but with prices off steeply Monday morning, it seems as if the Fed needed a “quick fix” to prevent a larger downdraft.
The good news is the bulls were able to defend the 200-dma once again successfully. However, the bears aren’t quite ready to give up just yet.
The Bull’s Case
The bullish case for the market is pretty thin.
- Hopes are high for a full reopening of the economy
- A vaccine
- A rapid return to economic normalcy.
- 2022 earnings will be sufficiently high enough to justify “current” prices. (Let that sink in – that’s two years of ZERO price growth.)
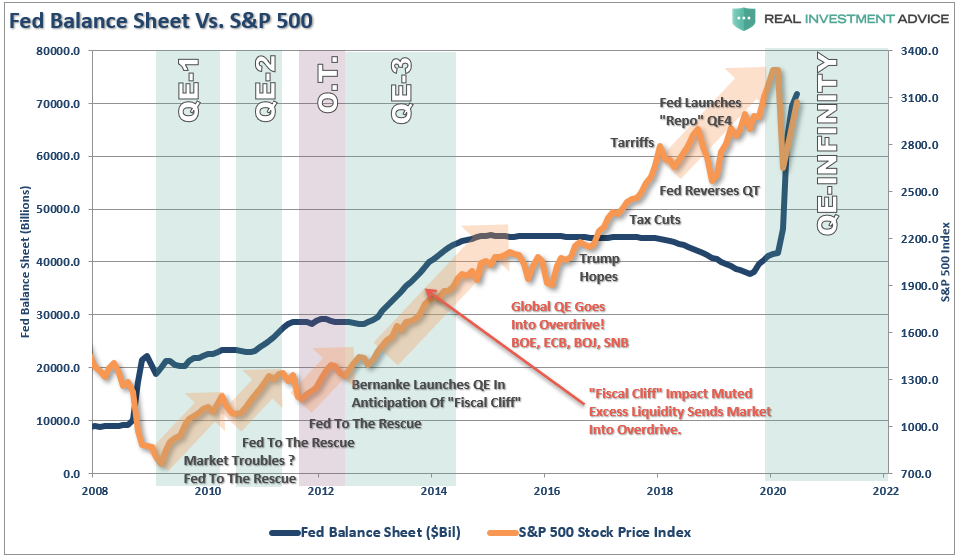
- The Fed.
In actuality, the first four points are rationalizations. It is the Fed’s liquidity driving the market.
The Bear’s Case
The bear’s built their case on more solid fundamental views.
- The potential for a second wave of the virus
- A slower than expected economic recovery
- A second wave of the virus erodes consumer confidence slowing employment
- High unemployment weighs on personal consumption
- Debt defaults and bankruptcies rise more sharply than expected.
- All of which translates into the sharply reduced earnings and corporate profitability.
Ultimately, corporate profits and earnings always matter, as discussed previously. (Historically, earnings never catch up with price.)
“Throughout history, earnings are very predictable. Using the analysis above, we can “guesstimate” the decline in earnings, and the potential decline in stock prices to align valuations. The chart below is the long-term log trend of earnings versus its exponential growth trend.”
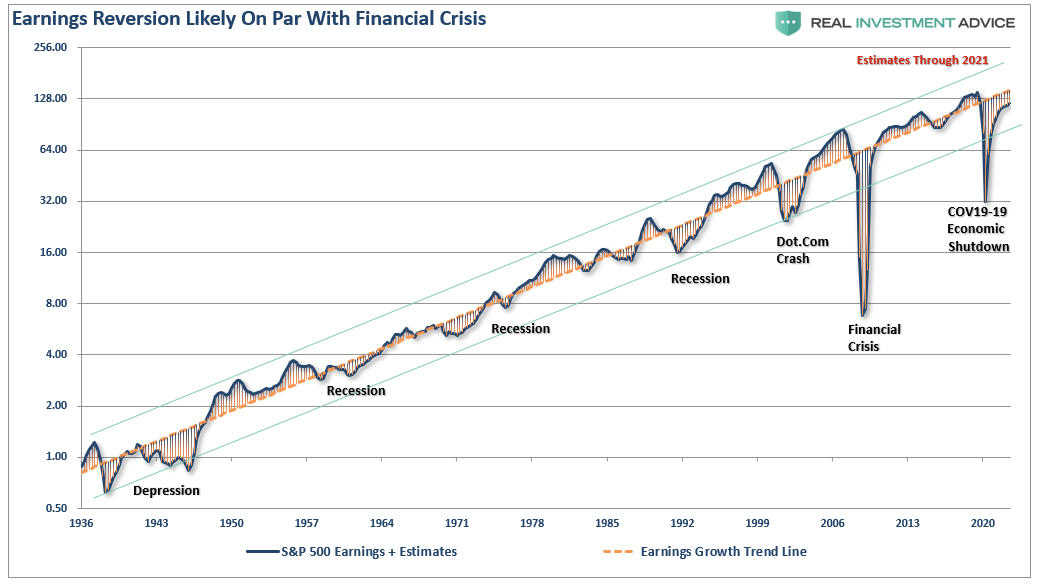
As we noted then, while “don’t fight the Fed” seems to be a simple formula for the bullish case, the deviation between “fundamentals” and “fantasy” will eventually matter.
What COVID-19 started, and has yet to complete, is the historical “mean reversion” process which has always followed bull markets. Such should not be a surprise as asset prices eventually reflect the underlying reality of corporate profitability and earnings.
Short-Term Bulls, Longer-Term Bears
From a purely technical perspective, the bulls remain in control for now. As shown below, the market was able to work off some of the short-term overbought condition without a confirmed break below the 200-dma. Importantly, the correction also held the uptrend line that has been running since the initial gap-up off the March 23rd low.
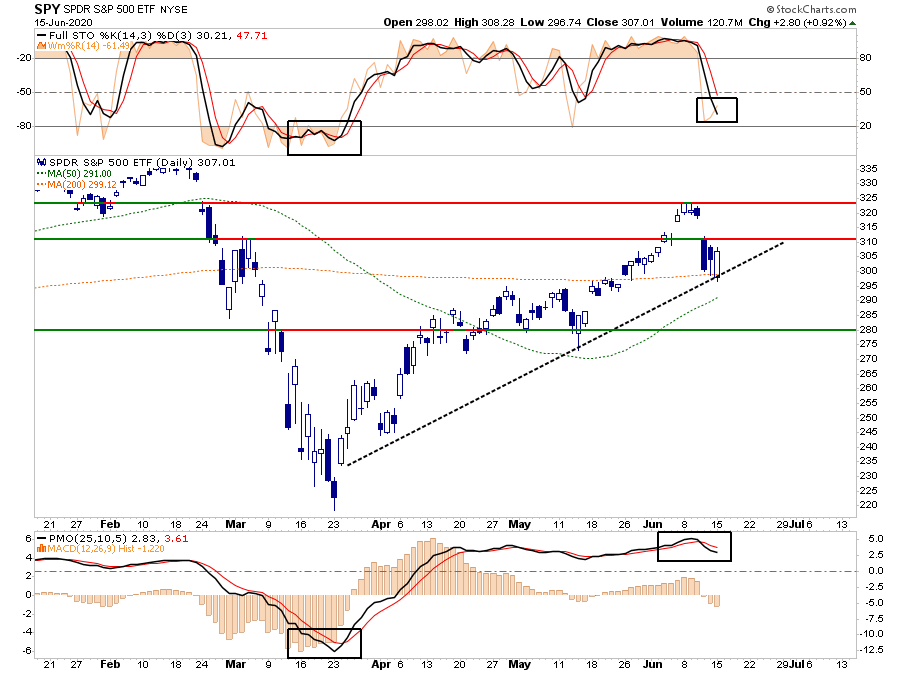
However, the lower MACD and Price Momentum Oscillator are on clear “sell signals,” which suggests risk to the bulls in the short-term. With resistance at Thursday’s “gap down” open just slightly above Monday’s close, the risk/reward for markets very short-term is poor.
If the market breaks the uptrend line, the 50-dma and the May consolidation range-lows will be the next lines in the sand.
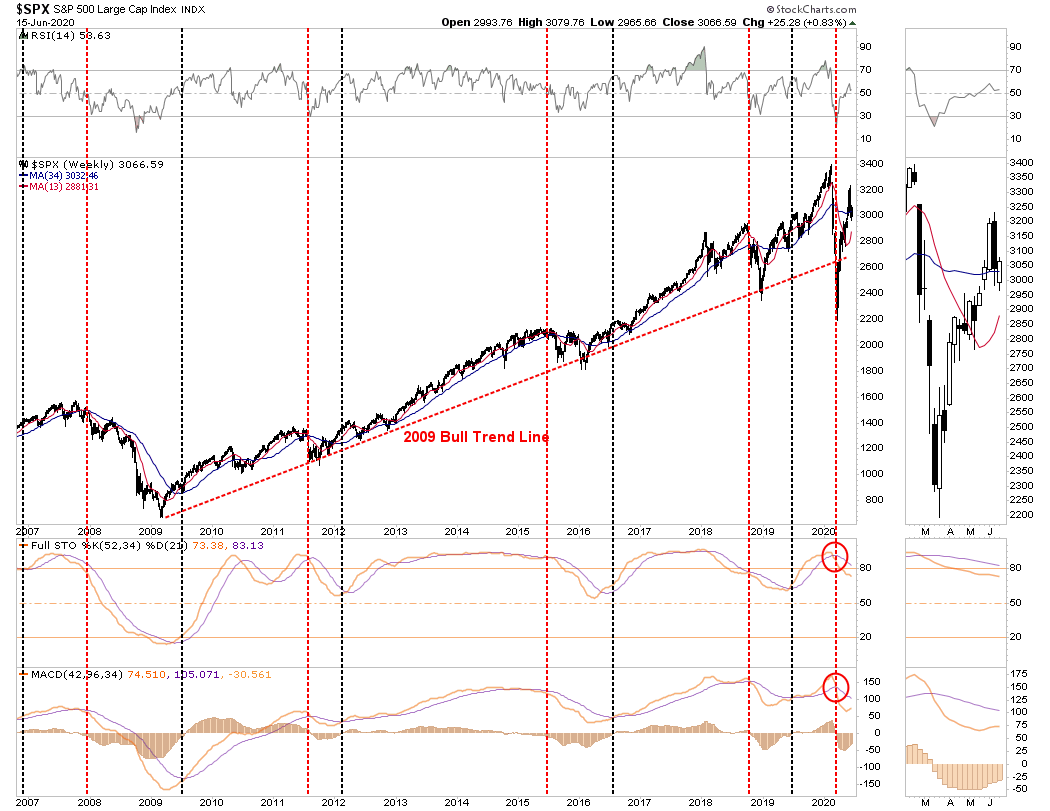
It is worth noting that both of the primary “sell signals” remain intact on a WEEKLY basis. Such suggests we may not be through the “bear market” phase just yet. While such doesn’t necessarily mean the market will crash, historically returns have been lower with much higher volatility.
Cautiously Bullish
Fundamentally speaking, we remain “bears.” However, we also realize that with the Federal Reserve intravenously feeding liquidity into the markets, we need to participate. As we stated last week:
“As a portfolio manager, we buy ‘opportunity’ because we have to. If we don’t, we suffer career risk, plain and simple. However, you don’t have to. If you are indeed a long-term investor, you have to question the risk undertaken to achieve further returns in the market currently.”
As noted, fundamentals will eventually matter. We just don’t know when that will ultimately be the case. However, there are more than enough signs to know we are likely close to a peak:
- Wall Street firms using 2-year forward “operating (or B.S.)” earnings to justify valuations.
- Investors are chasing bankrupt companies.
- Companies rampantly issuing debt to shore up liquidity
- A complete lack of market liquidity.
- Investor over-confidence
- Retail investor exuberance.
- Overly estimated future earnings growth.
You get the idea.
Playing Defense
What investor’s don’t realize is that they could be walking into a “trap.” As Carl Swenlin noted this past weekend:
"On Wednesday, we pointed out the similarities between this year’s price action and the price action during the 1929 crash and the rally that followed. Whether or not we have just seen the top of the rally, I believe there will be a top soon and that it will look like this.”
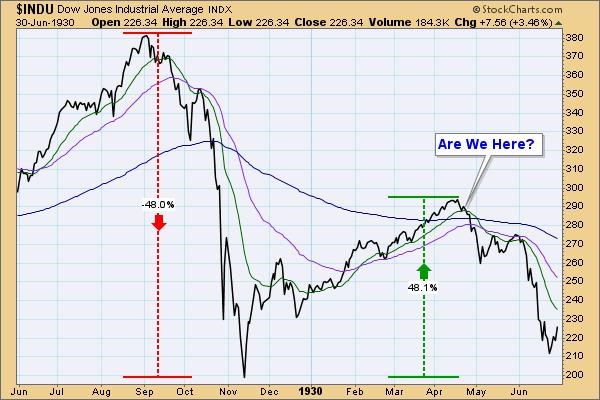
Whether or not you think such could be the case is irrelevant. What is important is to factor the “possibility” into your process. Here was Carl’s conclusion:
“Investors are ‘looking across the valley’ to the good times that await us there. They seem to believe that we will just levitate across the valley. But we can’t levitate. We have to go down into the valley and confront the many difficulties that await us there. People haven’t begun to imagine the storm we are walking into.”
Regardless of the Fed’s monetary policy, the markets will eventually have to deal with “What Is.” For investors, this leaves a very high potential for disappointment in the coming months as the realities of the worst recession in decades begins to unfold.
As noted last week, sometimes playing a bit of “defense” is the best “offense.”
