Get 40% Off
🚀 AI-picked stocks soar in May. PRFT is +55%—in just 16 days! Don’t miss June’s top picks.Unlock full list

Technical Turn May Be Close

Published 12/28/2016, 11:08 AM
Updated 07/09/2023, 06:31 AM
SPY
-
QQQ
-
GDX
-
VIX
-
  • SPX Monitoring purposes: Sold SPX on 12/14/16 at 2253.28 = + 2.48%; Long on 11/30/16 at 2198.81.
  • Monitoring purposes GOLD: Covered on 11/9/19 at 24.59 = gain .07%: Short GDX 11/2/16 at 24.78.
  • Long-Term Trend monitor purposes: Short SPX on 1/13/16 at 1890.28
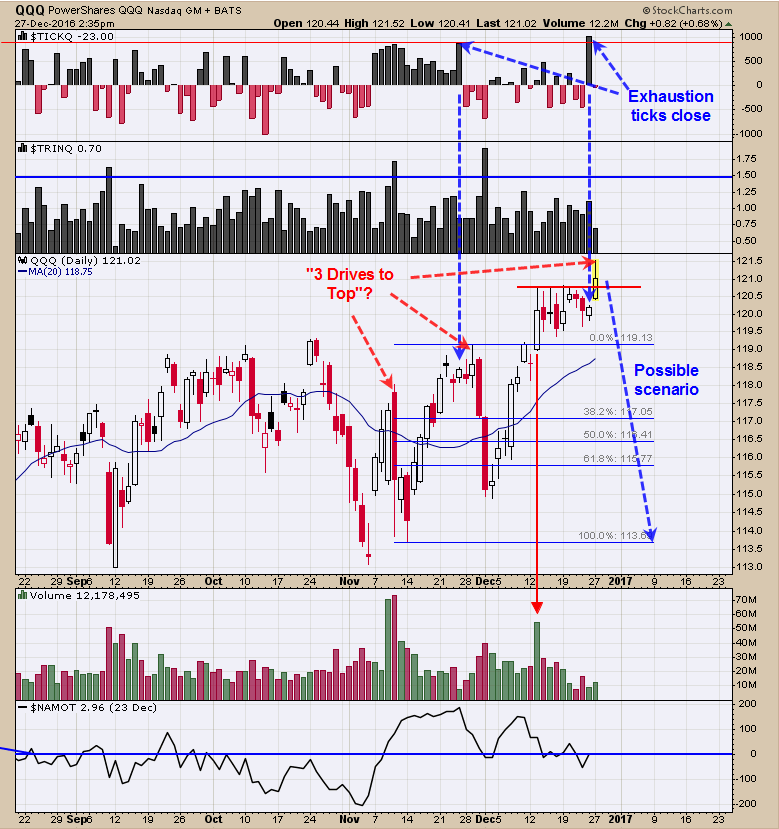
  • PowerShares QQQ Nasdaq

    The potential “Three Drives to Top” on the QQQ is still a possibility. Last Friday the TICKQ (Nasdaq Tick) closed at +1017, which represents short-term exhaustion. Also a surge in volume materialized on December 13, which also represents short-term exhaustion. The Santa Claus rally started last Friday and ends January 4 and if it turns out to be red, then January is also red (going back 20 years). The McClellan Oscillator closed at plus 50.27 and still above “0”. If McClellan Oscillator falls below “0”, a sell signal could develop. Neutral for now.
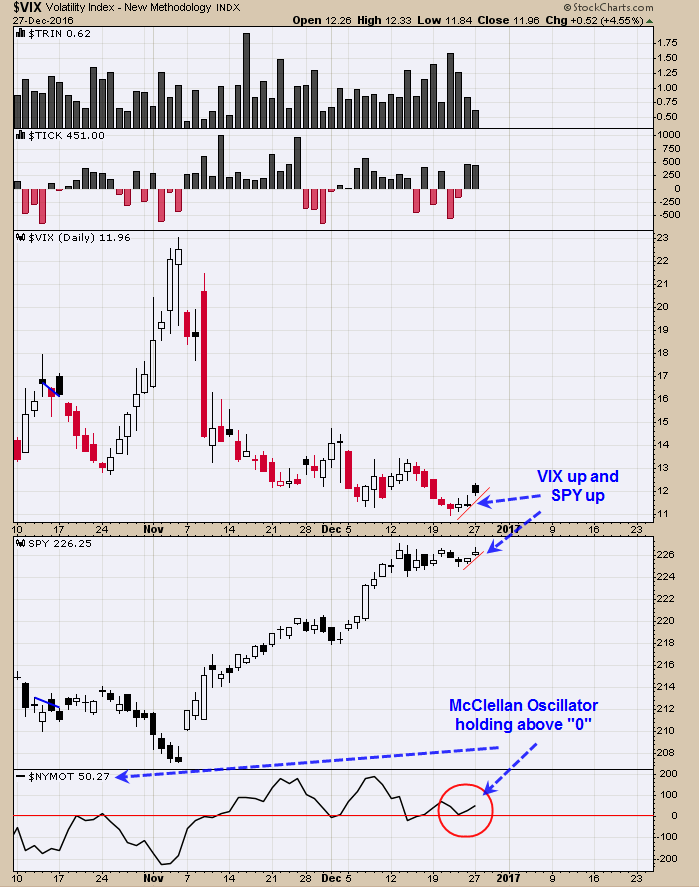
    Volatility (top), S&P 500

    The SPY has been up the last three days in a row and the VIX also has been up three days in a row. Normally the VIX trades opposite of the SPY and when both rally and fall together, it can be a “Heads up” that a turn in the market is close. However, as long as the NYSE McClellan Oscillator stays above “0”, the market is considered in an uptrend. Today the McClellan Oscillator closed at +50.27. Sold our long SPX position at 2253.28 for a gain of 2.48% on 12/15/16; Long SPX on 11/30/16 at 2198.81.
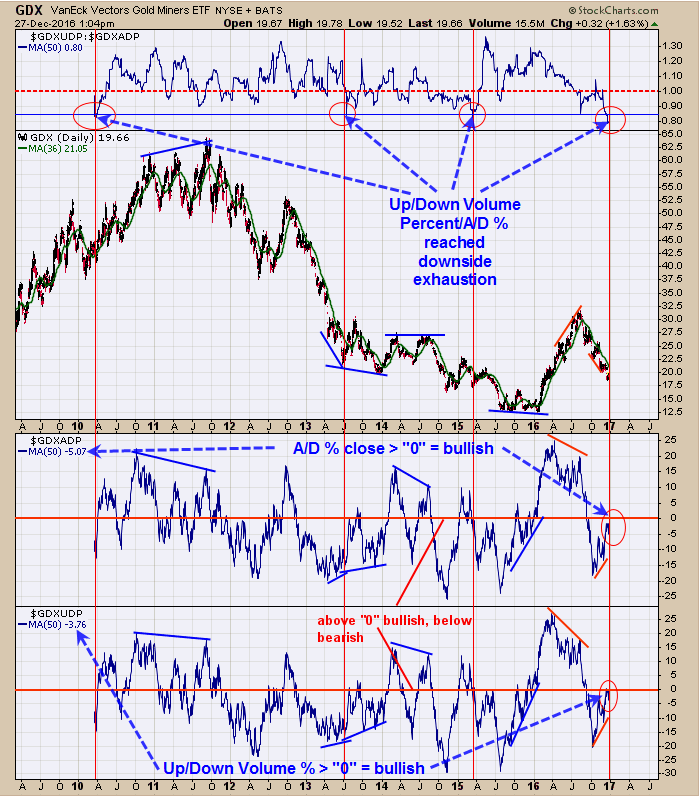
    Gold Miners

    The top window is the Up Down Volume %/ Advance/Decline % ratio. When this ratio reached below .85 (current reading .80) GDX was near an exhaustion low (identified by red vertical lines). The bottom window is the Up Down Volume percent. This indicator has been moving up since October while GDX was moving down and a positive divergence. A close above “0” on this indicator will be a positive for this market (Friday’s close -5.07). Next window up is the Advance/Decline Percent and this indicator also has been moving up since October and a positive divergence. A close above “0” on this indicator will be a positive for the market (Friday’s close –3.76) We are expecting a bullish outcome soon with these two indicators closing above “0” and momentum on GDX to turn up by a close above it 36 moving average. Still neutral for now.

Latest comments

Loading next article…
Risk Disclosure: Trading in financial instruments and/or cryptocurrencies involves high risks including the risk of losing some, or all, of your investment amount, and may not be suitable for all investors. Prices of cryptocurrencies are extremely volatile and may be affected by external factors such as financial, regulatory or political events. Trading on margin increases the financial risks.
Before deciding to trade in financial instrument or cryptocurrencies you should be fully informed of the risks and costs associated with trading the financial markets, carefully consider your investment objectives, level of experience, and risk appetite, and seek professional advice where needed.
Fusion Media would like to remind you that the data contained in this website is not necessarily real-time nor accurate. The data and prices on the website are not necessarily provided by any market or exchange, but may be provided by market makers, and so prices may not be accurate and may differ from the actual price at any given market, meaning prices are indicative and not appropriate for trading purposes. Fusion Media and any provider of the data contained in this website will not accept liability for any loss or damage as a result of your trading, or your reliance on the information contained within this website.
It is prohibited to use, store, reproduce, display, modify, transmit or distribute the data contained in this website without the explicit prior written permission of Fusion Media and/or the data provider. All intellectual property rights are reserved by the providers and/or the exchange providing the data contained in this website.
Fusion Media may be compensated by the advertisers that appear on the website, based on your interaction with the advertisements or advertisers.
© 2007-2024 - Fusion Media Limited. All Rights Reserved.