
Weekly Report
EUR/USD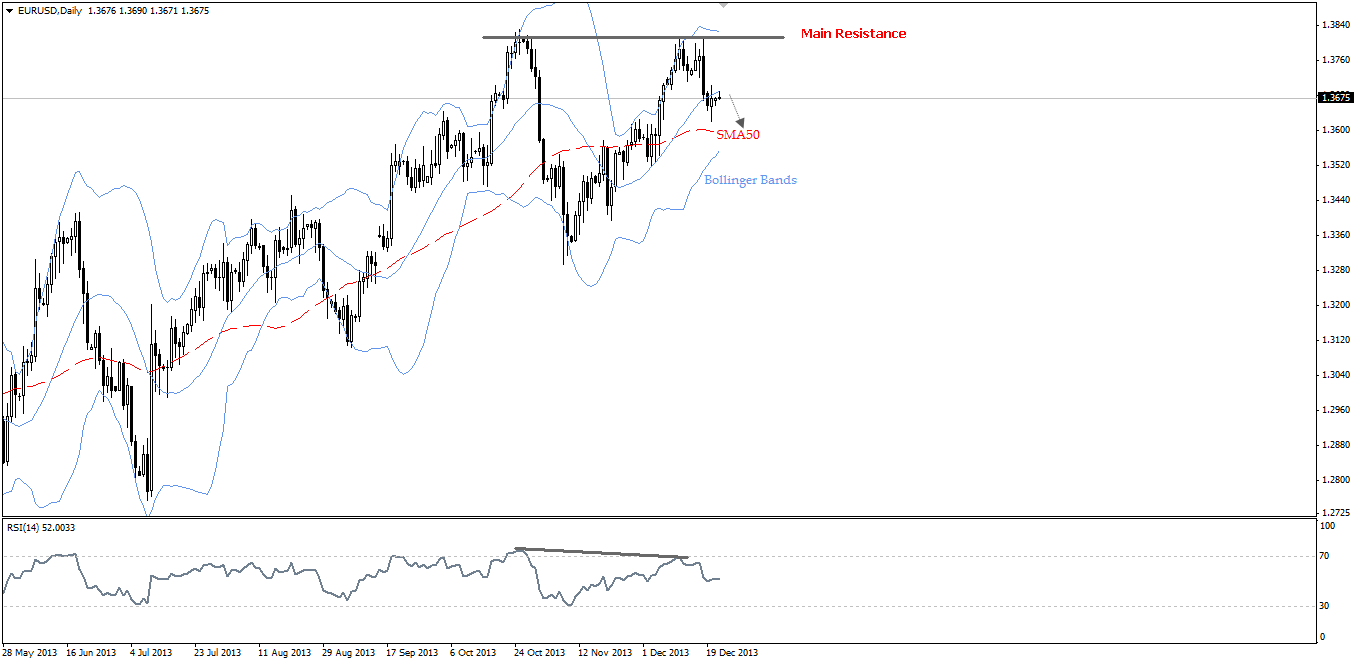 EUR/USD Daily Chart" title="EUR/USD Daily Chart" width="1356" height="661">
The pair has mildly retraced ahead of the closing of the previous week following the sharp decline seen on Wednesday and Thursday. However, the closing was achieved below the middle line of Bollinger bands, which represents a new technical obstacle. The bearish effect of the harmonic pattern discussed earlier over four hour interval is still in play, while hitting SMA 50 at 1.3600 is required to affirm the bearishness expected for this week. On the upside, taking out 1.3830 will negate our scenario.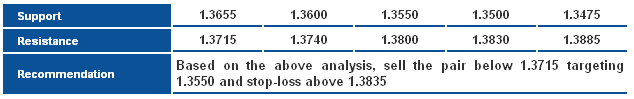 EUR/USD S&R Chart" title="EUR/USD S&R Chart" width="1356" height="661">
GBP/USD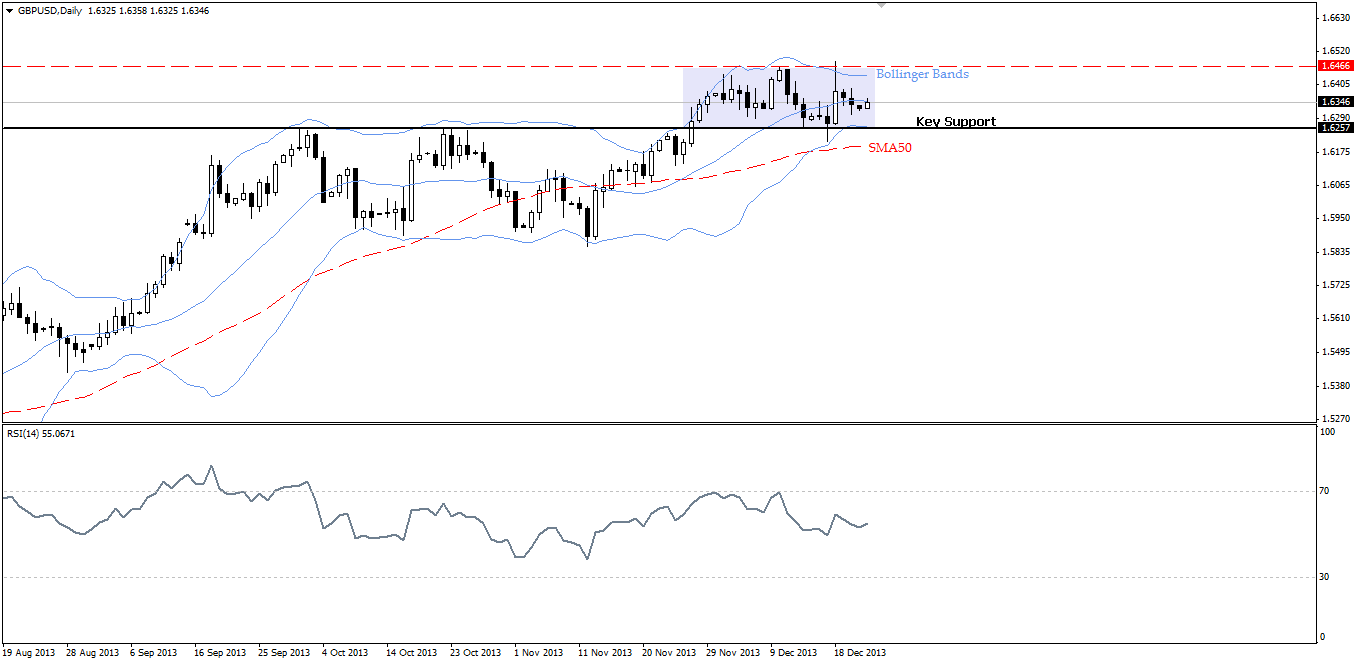 GBP/USD Daily Chart" title="GBP/USD Daily Chart" width="1356" height="661">
Prices are still showing some kind of technical hesitation inside the bands of Bollinger following the decline from 1.6500 regions as seen on the provided daily chart. The price behaviors inside the recent sideways range forces us to stay aside this week until traders show the ability of clearing 1.6460 or breaching 16255 to pinpoint the next big move.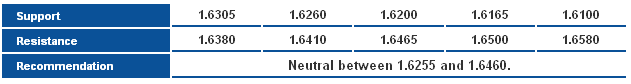 GBP/USD S&R Chart" title="GBP/USD S&R Chart" width="1356" height="661">
USD/JPY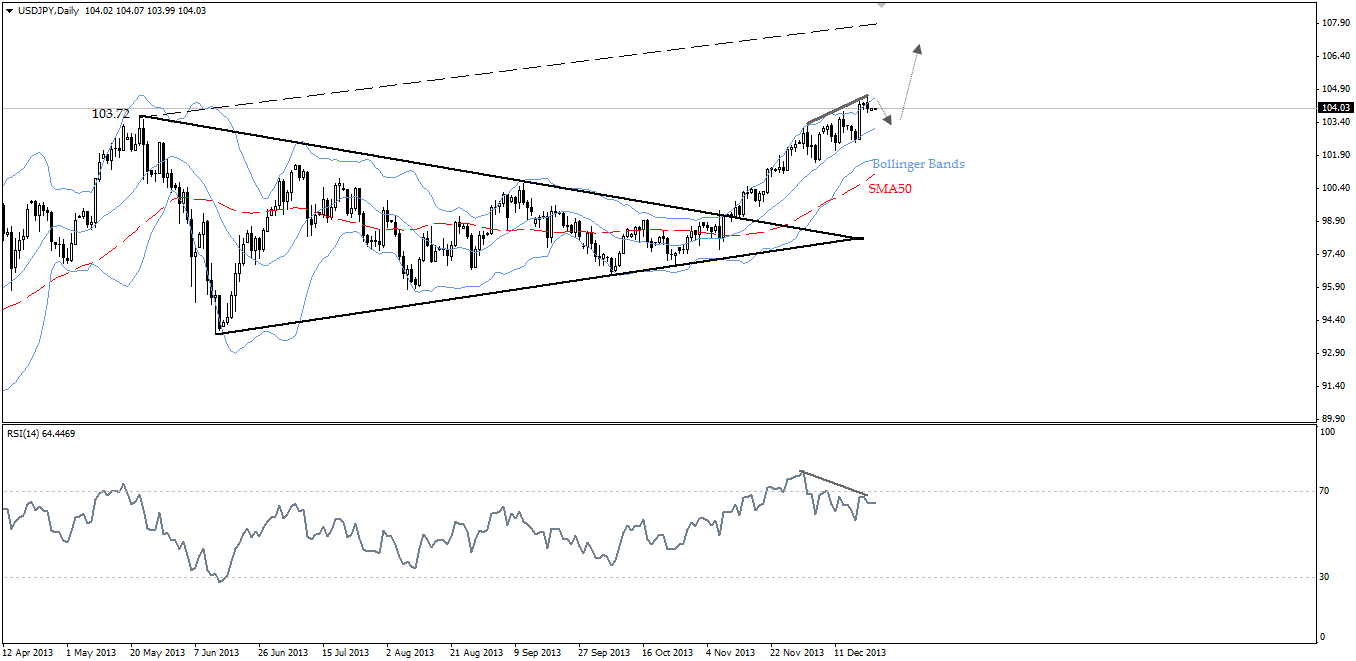 USD/JPY Daily Chart" title="USD/JPY Daily Chart" width="1356" height="661">
The USD/JPY is taking some kind of rest following sharp inclines seen during the previous period. Last Friday’s pause has created a negative divergence that may cause some kind of fluctuation, but the major upside trend remains intact as the symmetrical triangle formed over daily studies still has northern targets to reach. Hence, buying the pair on dips will be the favorite trading strategy for this week; noting that a break above 104.60 will accelerate.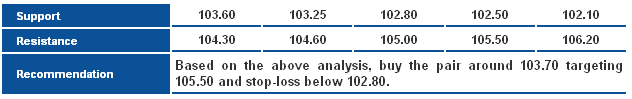 USD/JPY S&R Chart" title="USD/JPY S&R Chart" width="1356" height="661">
USD/CHF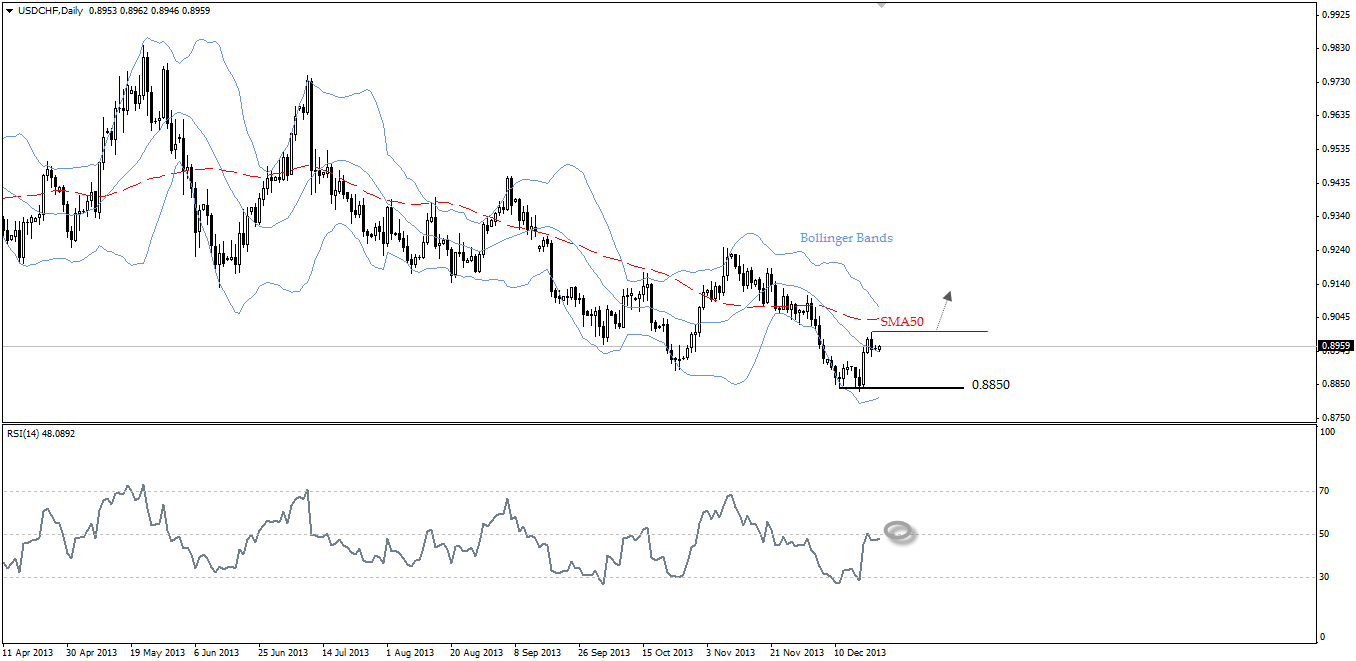 USD/CHF Daily Chart" title="USD/CHF Daily Chart" width="1356" height="661">
The pair is showing some kind of consolidation following the bounce from 0.8850 regions as seen on the provided daily chart. The bullish impetus interpreted on RSI 14 stopped by the value of 50.00 and thus, we need a breakout above the psychological level of 0.9000 to affirm the recent reversal. Note that, taking out SMA 50-valued at 0.9040- will bring additional buying interest. To recap, the bullishness is in favor as far as 0.8850 holds.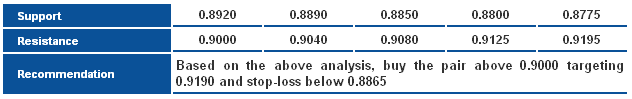 USD/CHF S&R Chart" title="USD/CHF S&R Chart" width="1356" height="661">
USD/CAD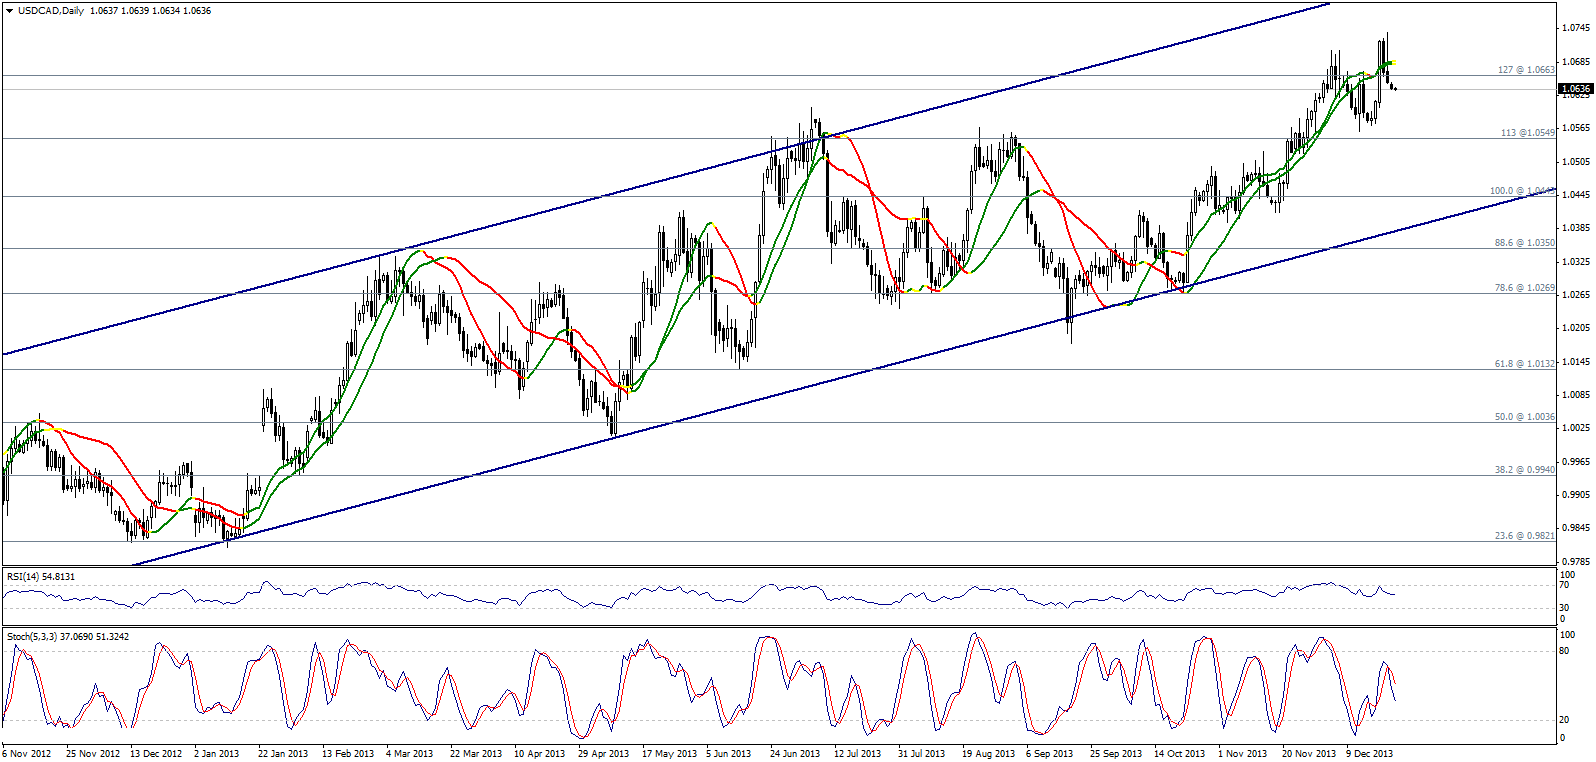 USD/CAD Daily Chart" title="USD/CAD Daily Chart" width="1356" height="661">
The pair is trading with negative bias with the kick-start of the weekly below 1.0660, affected by negativity on Stochastic. The general uptrend remains intact over intraday basis depending on stability above 1.0545 and most importantly above 1.0395. Our upside targets extend toward 1.0830.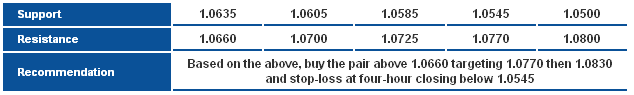 USD/CAD S&R Chart" title="USD/CAD S&R Chart" width="1356" height="661">
AUD/USD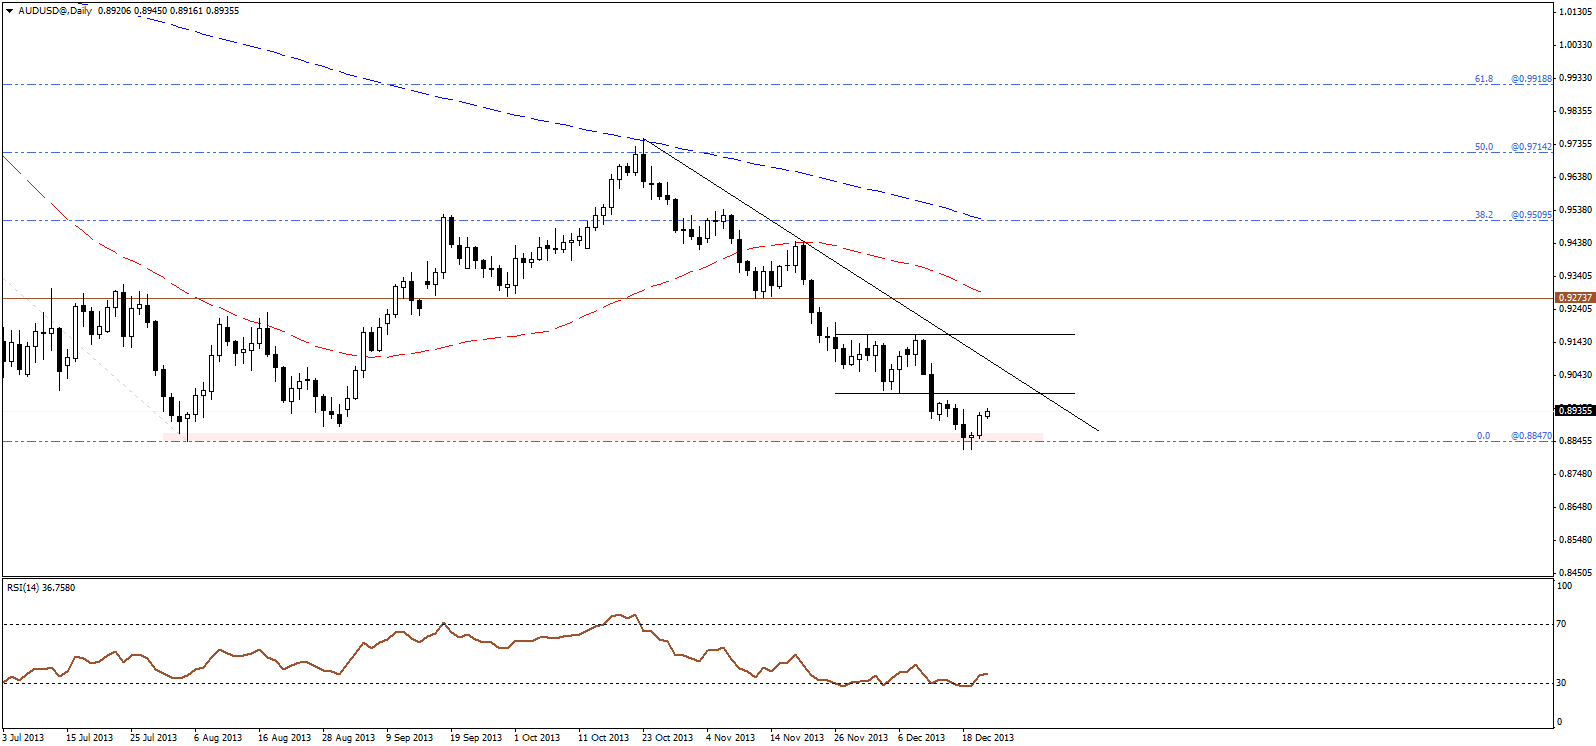 AUD/USD Daily Chart" title="AUD/USD Daily Chart" width="1356" height="661">
The pair bounced higher after testing the main support at 0.8845, to correct some of the recent losses, where we expect some further upside and sideways bias this week. A retest of 0.9900 resistance is likely and the main descending resistance for the bearish trend.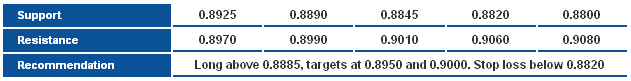 AUD/USD S&R Chart" title="AUD/USD S&R Chart" width="1356" height="661">
NZD/USD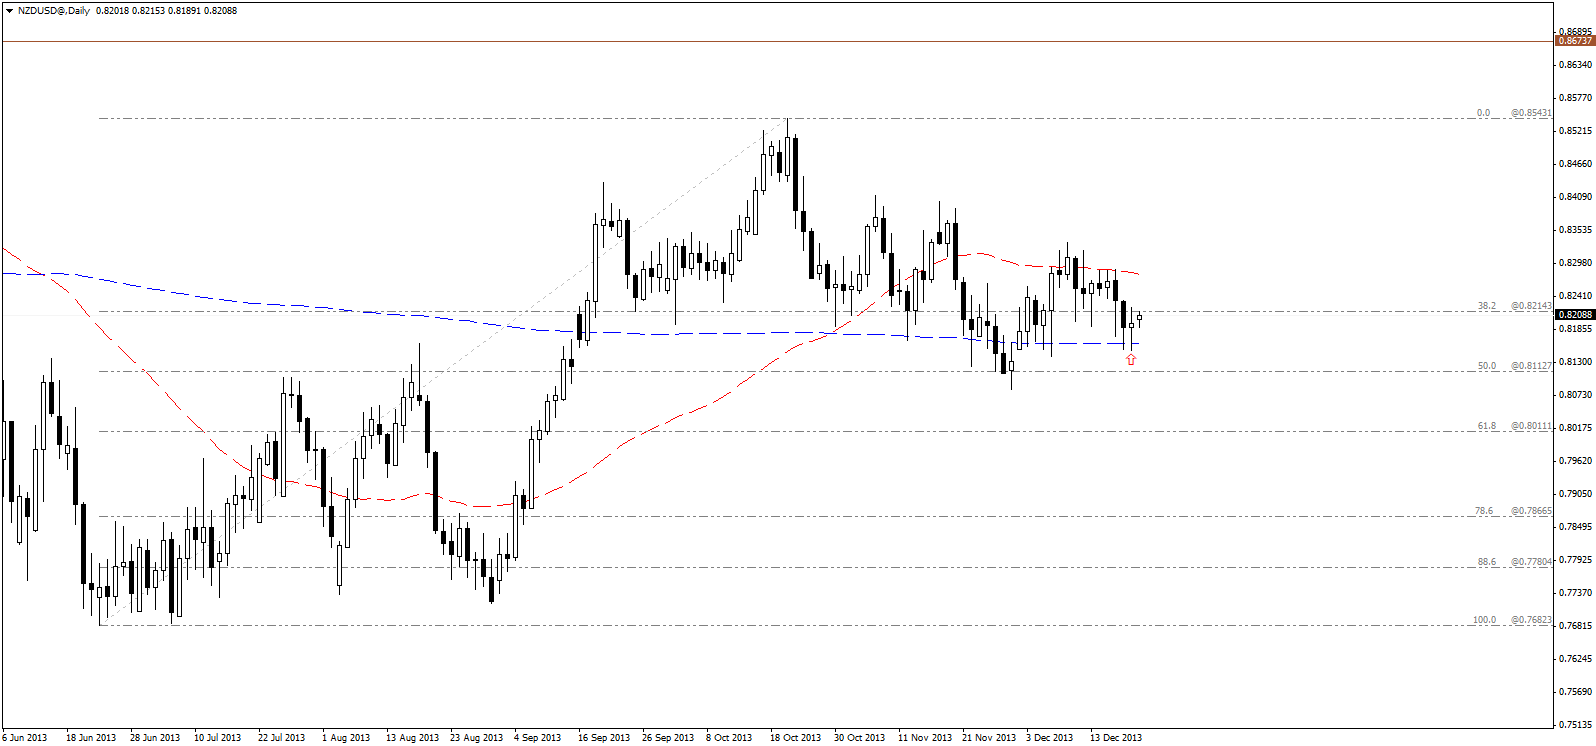 NZD/USD Daily Chart" title="NZD/USD Daily Chart" width="1356" height="661">
The pair maintains the choppy action, as price bounced of the 200-days SMA on Friday, forming a spinning top candle, and accordingly, we may see a bounce higher this week, however should be within the context of the overall sideways bias.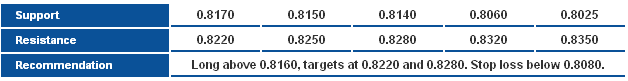 NZD/USD S&R Chart" title="NZD/USD S&R Chart" width="1356" height="661">