
EUR/USD: Weekly Report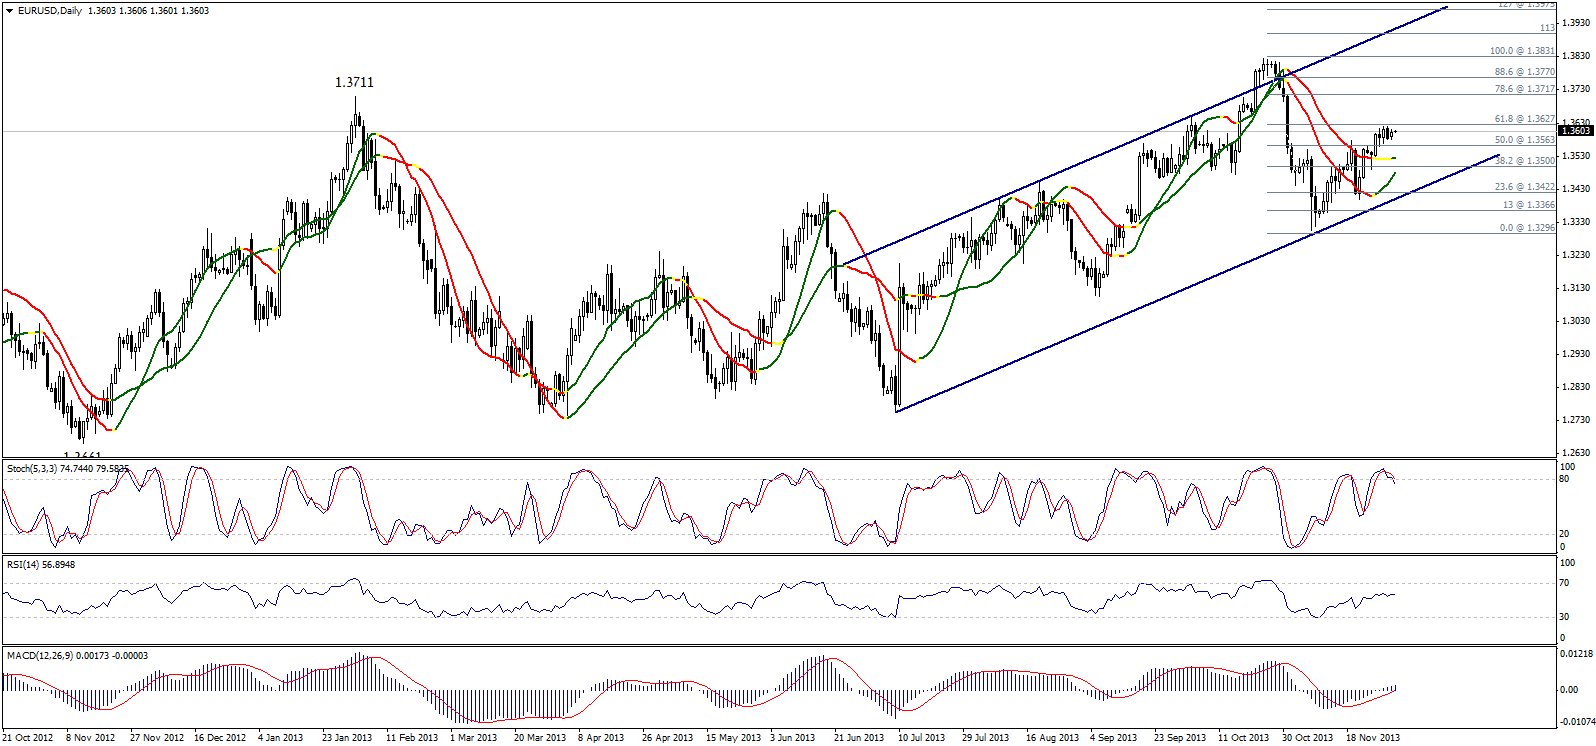 EUR/USD Daily Chart" title="EUR/USD Daily Chart" width="1596" height="747">
The pair traded in a tight range last week consolidating above 50% correction at 1.3560 levels. Stochastic is showing intraday overbought signals being the only indicator showing negativity, while the rest of the indicators tend to be positive. Trading within an upside move might extend over the week, as the suggested targets resides at 1.3715 and 1.3770. The bullish possibility remains valid by stabilizing above 38.2% correction at 1.3500.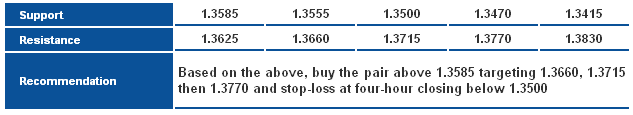 EUR/USD S&R Chart" title="EUR/USD S&R Chart" width="1596" height="747">
GBP/USD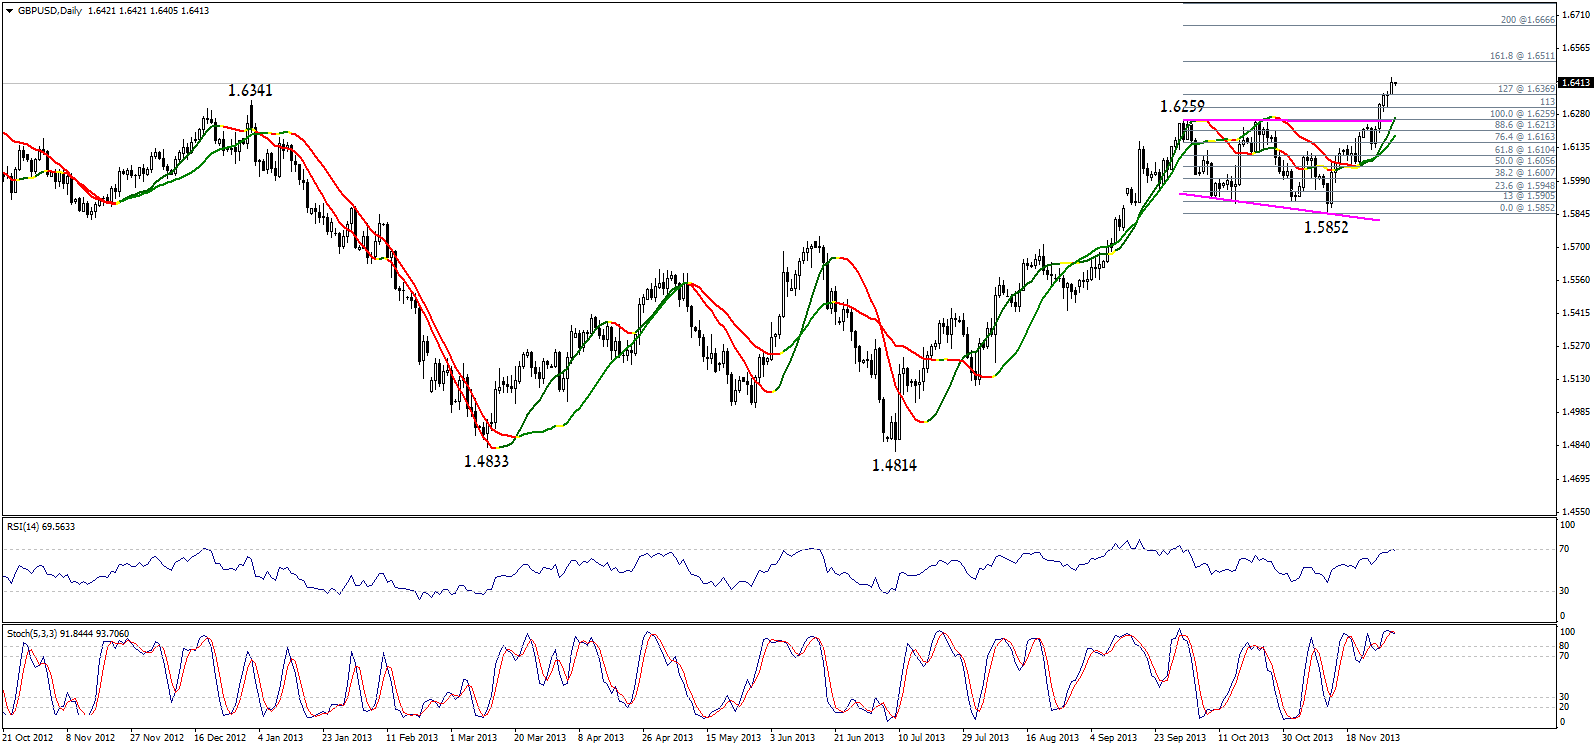 GBP/USD Daily Chart" title="GBP/USD Daily Chart" width="1596" height="747">
The pair moved sharply to the upside consolidating above 1.6370 with the beginning of the week, as stabilizing above the referred to level extends bullishness reaching 1.6510. Breaching 1.6510 represented in 161.8% correction is significant to gain the pair further bullish momentum this week and to cancel any overbought effect showing on momentum indicators.
Trading above 1.6260 is positive, because its capable of keeping the bullish continuous classic formation valid. Stabilizing above 1.6340 is more positive and could keep our expectations this week.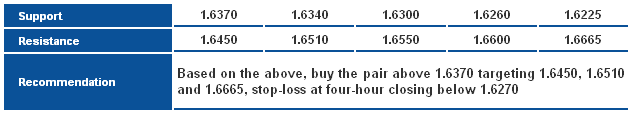 GBP/USD S&R Chart" title="GBP/USD S&R Chart" width="1596" height="747">
USD/JPY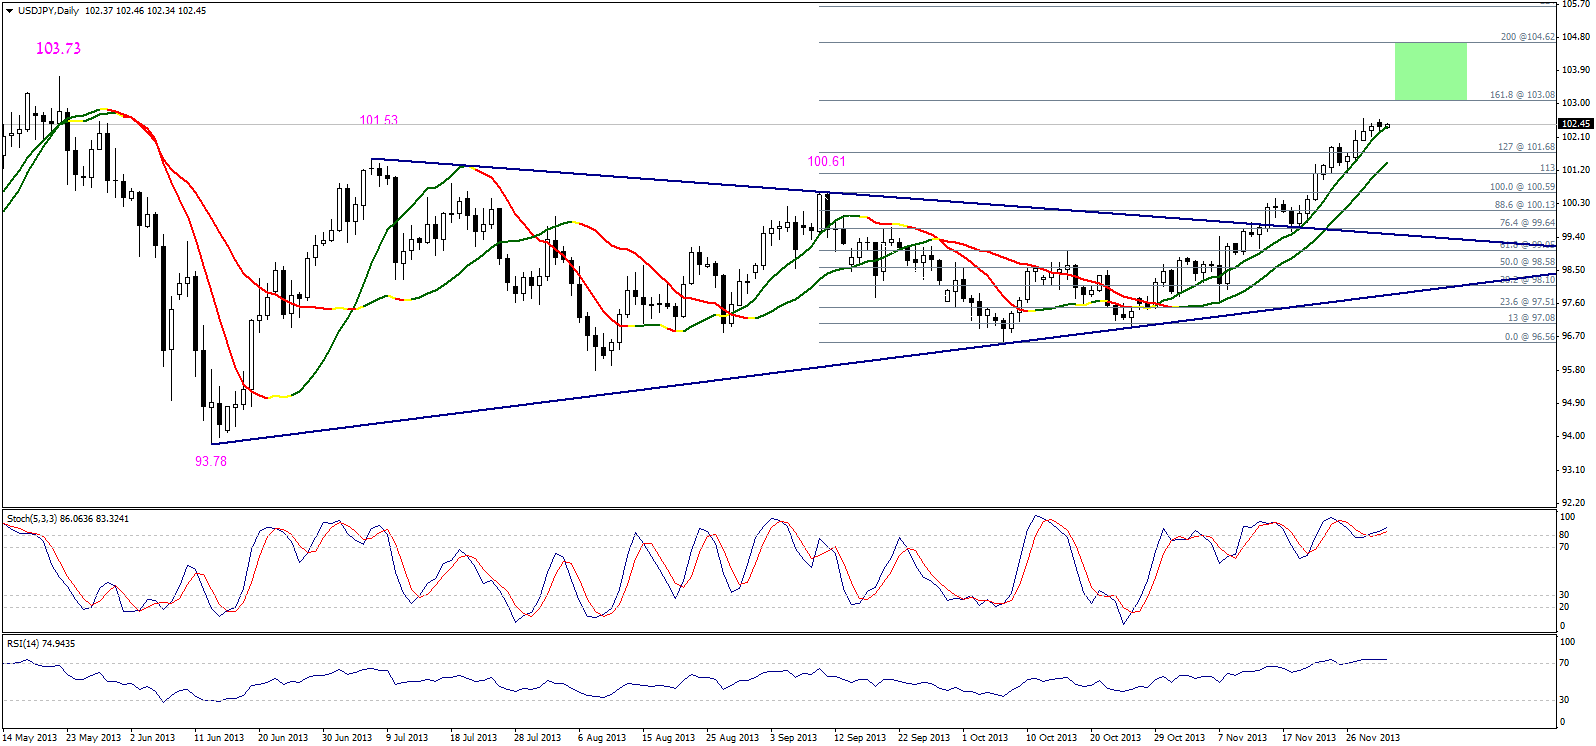 USD/JPY Daily Chart" title="USD/JPY Daily Chart" width="1596" height="747">
The pair extended the upside move benefiting from stabilizing above Linear Regression Indicators especially Linear Regression Indicator 34 which represents a support the pair remained above since 8 of November. Stability above 101.65 levels keeps the possibility of extending bullishness this week starting from 103.10 then the previous top 103.73 and perhaps 104.65. All these targets requires breaching 103.10 which represents our significant interval for this week.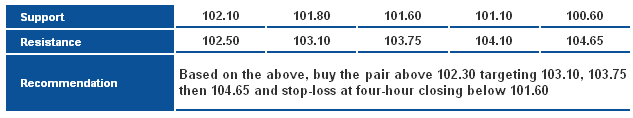 USD/JPY S&R Chart" title="USD/JPY S&R Chart" width="1596" height="747">
USD/CHF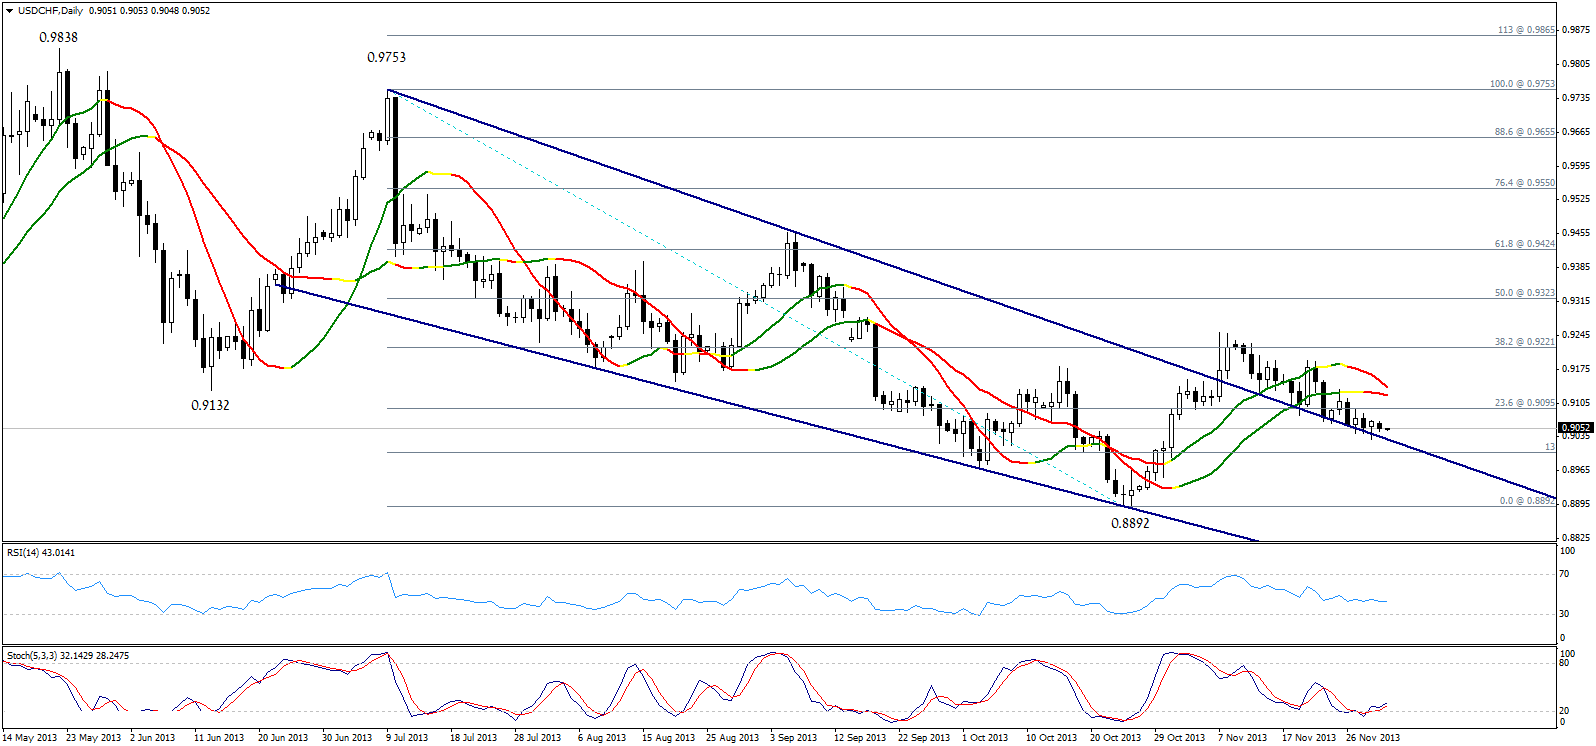 USD/CHF Daily Chart" title="USD/CHF Daily Chart" width="1596" height="747">
Consolidating below 0.9095 triggers negative pressure, as RSI is showing bearish momentum that broke line 50 to the downside. The possibility of extending the downside move is valid depending on breaking 0.9000 levels. Succeeding in breaking 0.9000 and stability below it might trigger another bearish wave this week.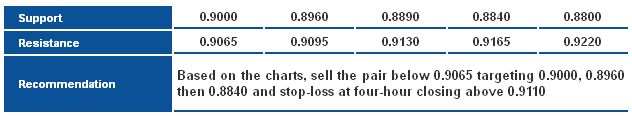 USD/CHF S&R Chart" title="USD/CHF S&R Chart" width="1596" height="747">
USD/CAD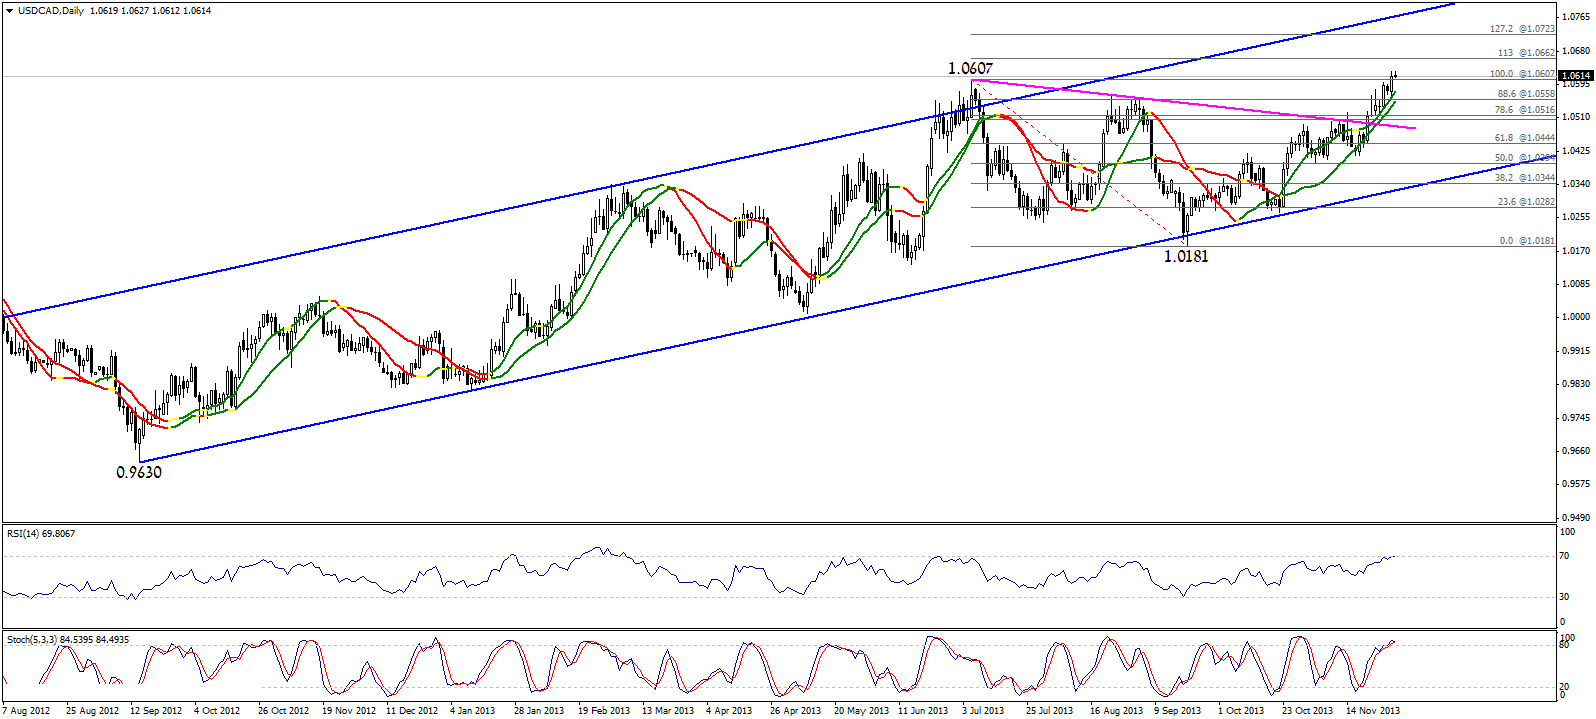 USD/CAD Daily Chart" title="USD/CAD Daily Chart" width="1596" height="747">
The pair moved to its highest levels since the fourth of October 2011. The possibility of extending bullishness is valid this week, while the positive signals are still showing on Linear Regression Indicators and there are still targets of the ascending channel starting from 14/09/2012 at 0.9630. This week, breaking 1.0500 could fail our positive expectations and trading above the referred to level strengthen the bullish possibility. USD/CAD S&R Chart" title="USD/CAD S&R Chart" width="1596" height="747">
AUD/USD AUD/USD Daily Chart" title="AUD/USD Daily Chart" width="1596" height="747">
The pair rebounds after testing the bottom of the short term descending channel shown on chart, just above the 78.6 retracement level, we see further upside correctional bias this week, initially towards 0.9205 and possibly 0.9275.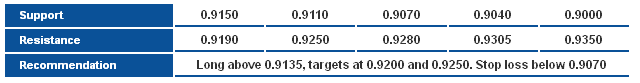 AUD/USD S&R Chart" title="AUD/USD S&R Chart" width="1596" height="747">
NZD/USD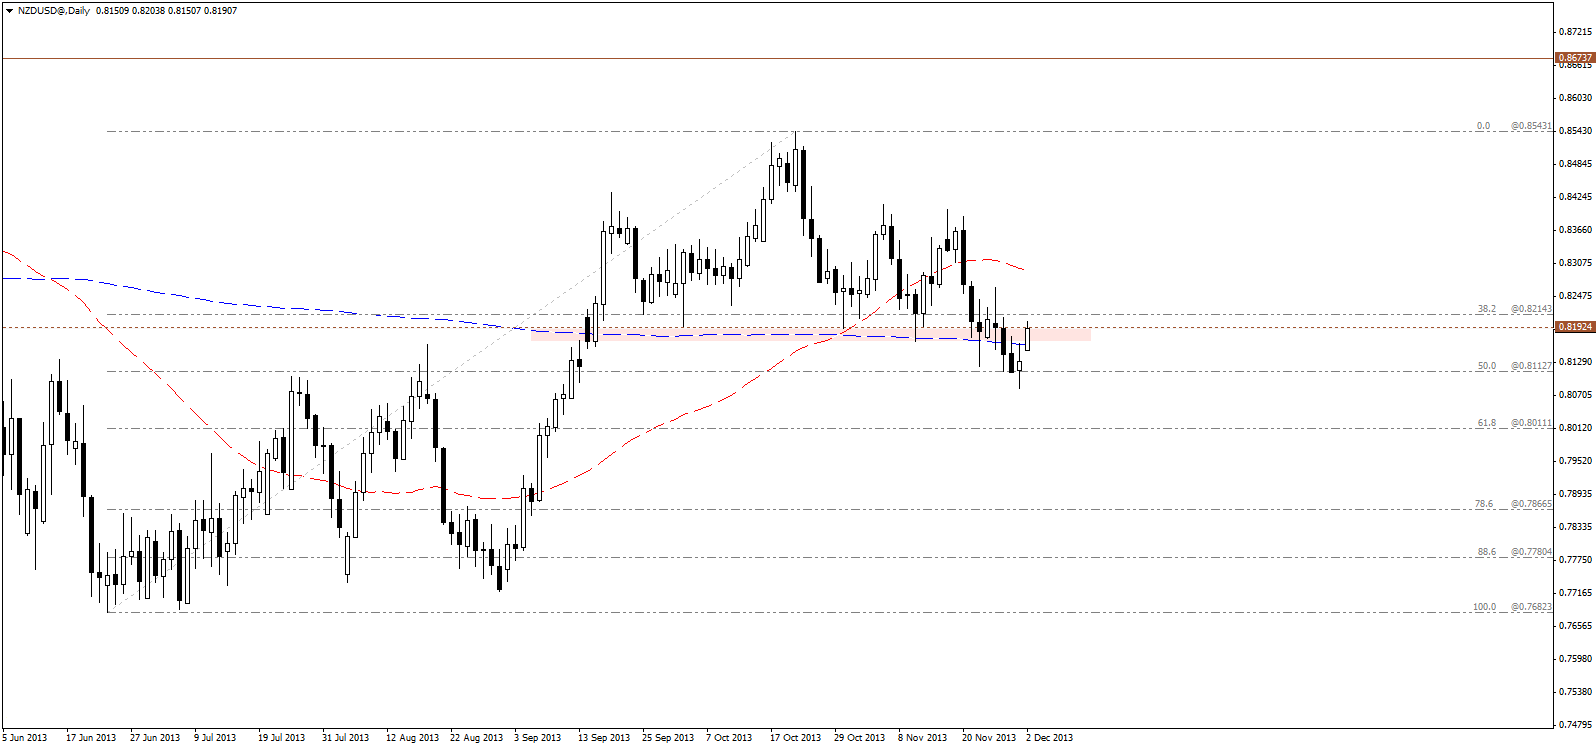 NZD/USD Daily Chart" title="NZD/USD Daily Chart" width="1596" height="747">
The price is retesting the major broken support area shown on chart and around 0.8190, after it was rejected of the 50 percent retracement level for the overall bullish trend. Although this might be a normal retest ahead of resuming the bearish breakout, we would like to see how price reacts to the retest of this broken support-turned-resistance before suggesting the next potential direction.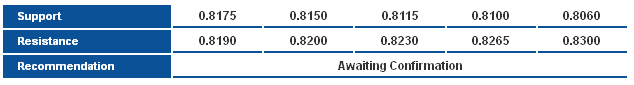 NZD/USD S&R Chart" title="NZD/USD S&R Chart" width="1596" height="747">