
*All the charts are 30M charts with daily pivot points.
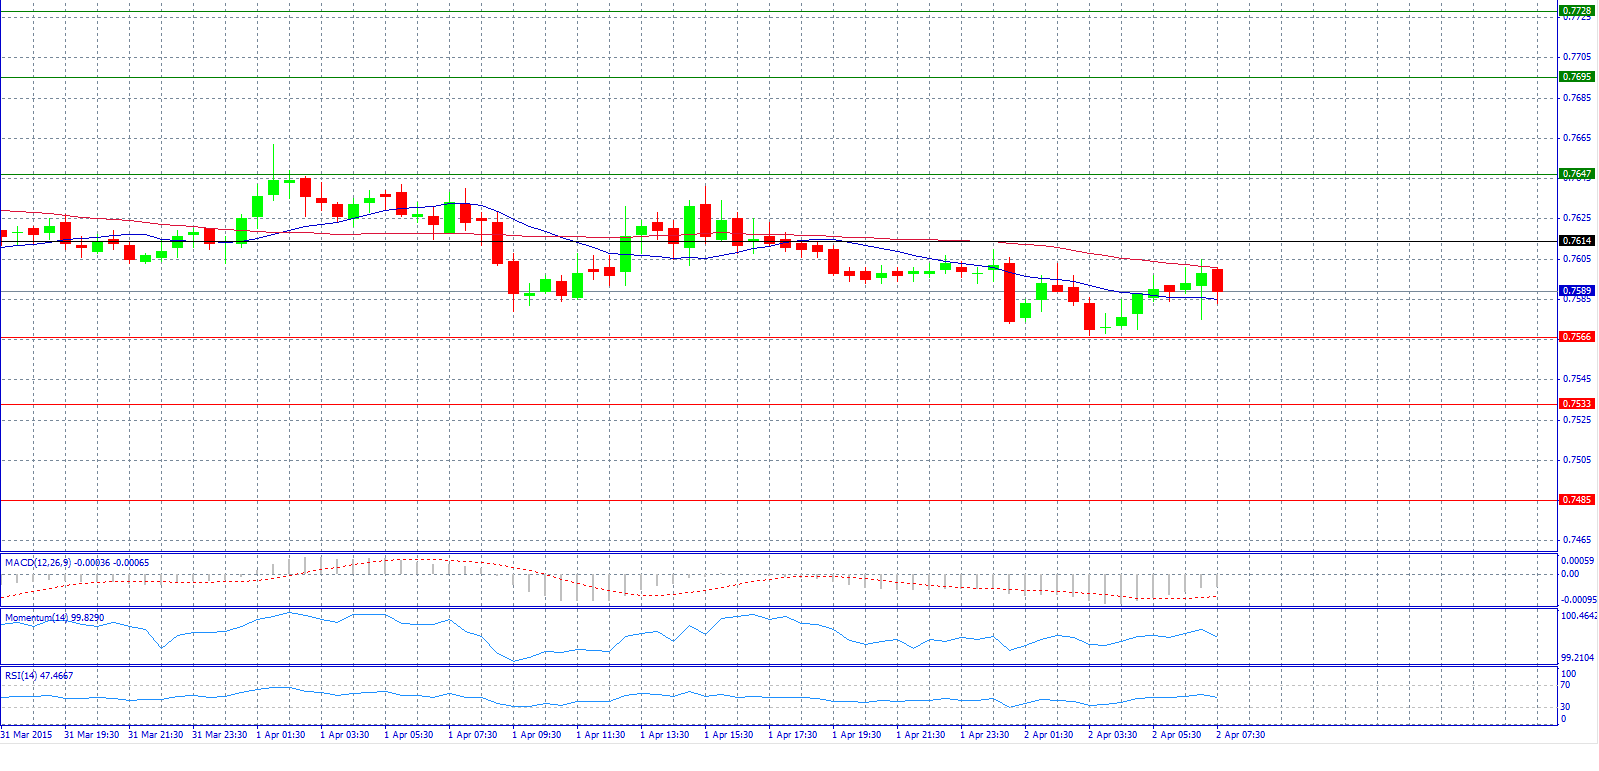
Market Scenario 1: Long positions above 0.7614 with target @ 0.7647.
Market Scenario 2: Short positions below 0.7614 with target @ 0.7533.
Comment: The pair shows a negative tone with the bearish threat to break the first support level at 0.7566.
Supports and Resistances:
R3 0.7728
R2 0.7695
R1 0.7647
PP 0.7614
S1 0.7566
S2 0.7533
S3 0.7485

Market Scenario 1: Long positions above 128.90 with target @ 129.96.
Market Scenario 2: Short positions below 128.90 with target @ 128.36.
Comment: The pair advanced higher above the pivot point at 128.90.
Supports and Resistances:
R3 130.48
R2 129.96
R1 129.42
PP 128.90
S1 128.36
S2 127.84
S3 127.30

Market Scenario 1: Long positions above 1.0760 with target @ 1.0882.
Market Scenario 2: Short positions below 1.0760 with target @ 1.0720.
Comment: The pair tested and surpassed 1.0800 level.
Supports and Resistances:
R3 1.0882
R2 1.0841
R1 1.0801
PP 1.0760
S1 1.0720
S2 1.0679
S3 1.0639

Market Scenario 1: Long positions above 177.55 with target @ 178.34.
Market Scenario 2: Short positions below 177.55 with target @ 176.69.
Comment: The pair weakened to 177.33 levels during the European session today but now managed to advance higher and trade near pivot point at 177.55 level.
Supports and Resistances:
R3 179.99
R2 179.20
R1 178.34
PP 177.55
S1 176.69
S2 175.90
S3 175.04

Market Scenario 1: Long positions above 1.4810 with target @ 1.4941.
Market Scenario 2: Short positions below 1.4810 with target @ 1.4751.
Comment: The pair pushes to highs near 1.4860 level.
Supports and Resistances:
R3 1.5013
R2 1.4941
R1 1.4882
PP 1.4810
S1 1.4751
S2 1.4679
S3 1.4620

Market Scenario 1: Long positions above 119.82 with target @ 120.23.
Market Scenario 2: Short positions below 119.82 with target @ 118.91.
Comment: The pair hovers around 119.50.
Supports and Resistances:
R3 121.14
R2 120.73
R1 120.23
PP 119.82
S1 119.32
S2 118.91
S3 118.41

Market Scenario 1: Long positions above 1197.60 with target @ 1225.80.
Market Scenario 2: Short positions below 1197.60 with target @ 1186.50.
Comment: Gold prices latched on to the weaker dollar yesterday with prices rising above 1203.00 level.
Supports and Resistances:
R3 1242.90
R2 1225.80
R1 1214.70
PP 1197.60
S1 1186.50
S2 1169.40
S3 1158.30

Market Scenario 1: Long positions above 49.02 with target @ 50.98.
Market Scenario 2: Short positions below 49.02 with target @ 47.58.
Comment: Crude oil prices advanced the most in two months.
Supports and Resistances:
R3 54.38
R2 52.42
R1 50.98
PP 49.02
S1 47.58
S2 45.62
S3 44.18

Market Scenario 1: Long positions above 56.705 with target @ 57.158.
Market Scenario 2: Short positions below 56.705 with target @ 55.471.
Comment: The pair shows weakness as Russia frees itself from oil's curse.
Supports and Resistances:
R3 59.173
R2 57.939
R1 57.158
PP 56.705
S1 55.924
S2 55.471
S3 54.237