
Preparing For Important Data
According to the National Weather Service's Climate Prediction Center (CPC), the likelihood of the El Nino formation in autumn of the current year increased to 65% and to 70% in winter 2018/19. Will cocoa prices rise?
El Nino can have a negative impact on cocoa yields in West Africa. Previously, the CPC reported that the probability of its formation this summer is estimated as "neutral." Cocoa prices may react to reports on bean processing for the 2nd quarter of 2018. European producers of cocoa products will release their reports on July 16, and North American on July 19. According to forecasts, cocoa processing in Europe may increase by 3% compared to the second quarter of the last year. In North America, its volumes are likely to remain unchanged. From October 1 to July 8, the delivery of cocoa to the Côte d'Ivoire’s export ports in the current agricultural season decreased by 3% compared to the same period of the last season and amounted to 1,787 million tons.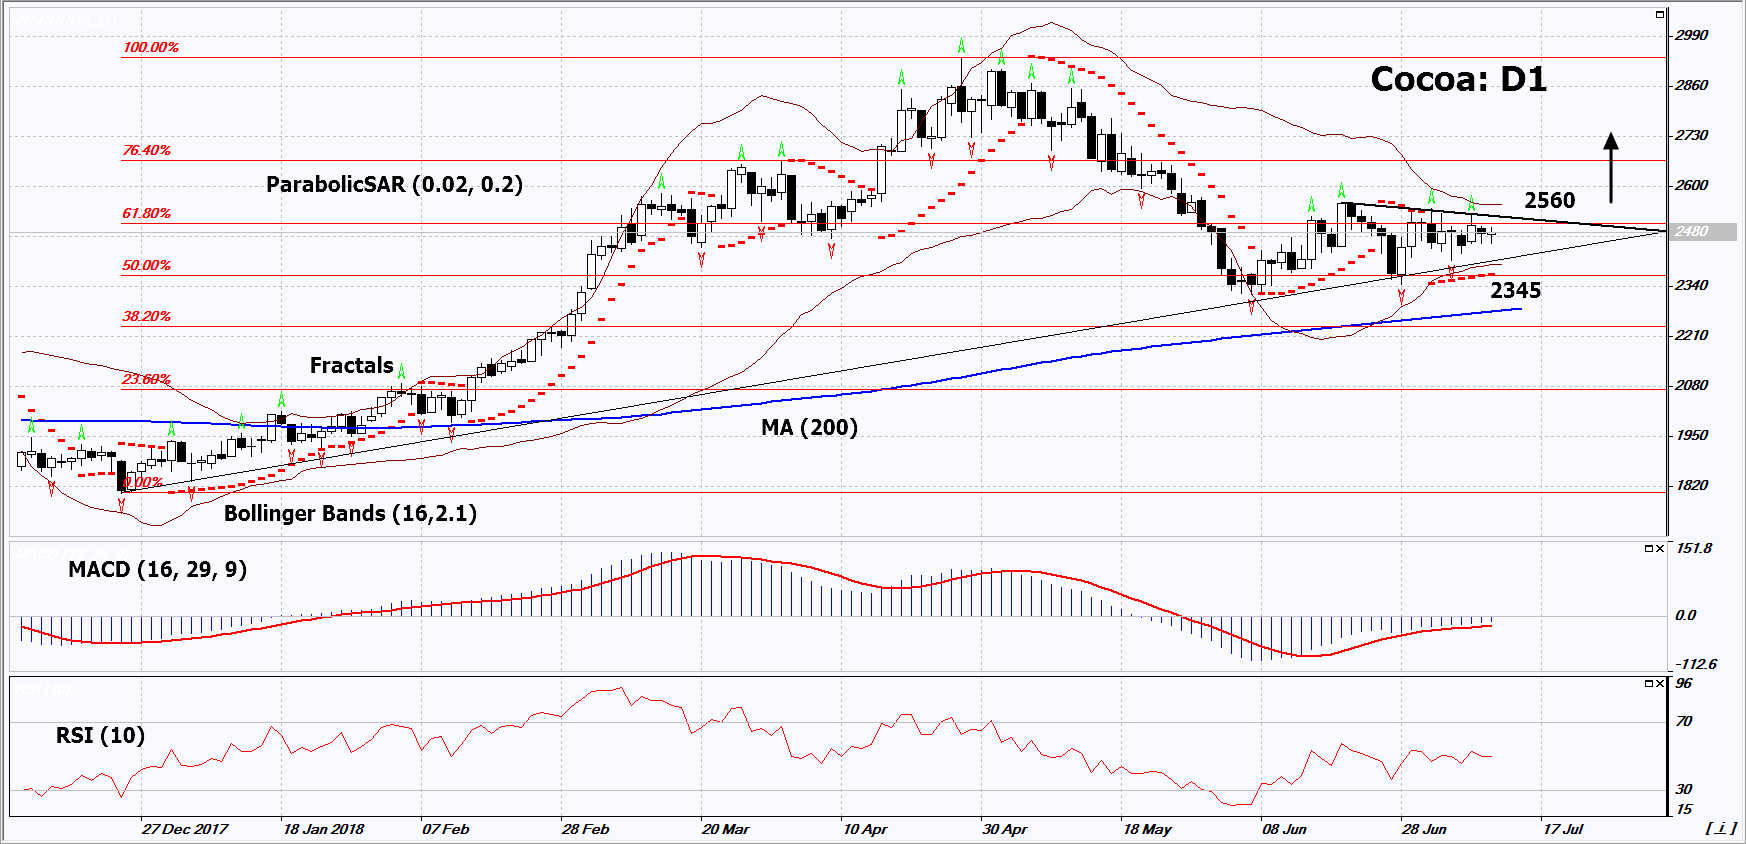
On the daily timeframe, Cocoa: D1 corrected by 50% (by Fibonacci) after a noticeable increase and is now traded in a narrow range. A number of technical analysis indicators formed buy signals. The further price increase is possible in case of increased volumes of processing in Europe and North America, as well as in case of the deterioration of weather conditions in North Africa.
- The Parabolic indicator gives a bullish signal.
- The Bollinger® bands have narrowed, which indicates low volatility.
- The RSI indicator is below 50. No divergence.
- The MACD indicator gives a bullish signal.
The bullish momentum may develop in case Cocoa exceeds the three last fractal highs and the upper Bollinger band at 2560. This level may serve as an entry point. The initial stop loss may be placed below the two last fractal lows, the lower Bollinger band and the Parabolic signal at 2345. After opening the pending order, we shall move the stop to the next fractal low following the Bollinger and Parabolic signals. Thus, we are changing the potential profit/loss to the breakeven point. More risk-averse traders may switch to the 4-hour chart after the trade and place there a stop loss moving it in the direction of the trade. If the price meets the stop level (2345) without reaching the order (2560), we recommend to close the position: the market sustains internal changes that were not taken into account.
Summary of technical analysis
Position Buy
Buy stop Above 2560
Stop loss Below 2345