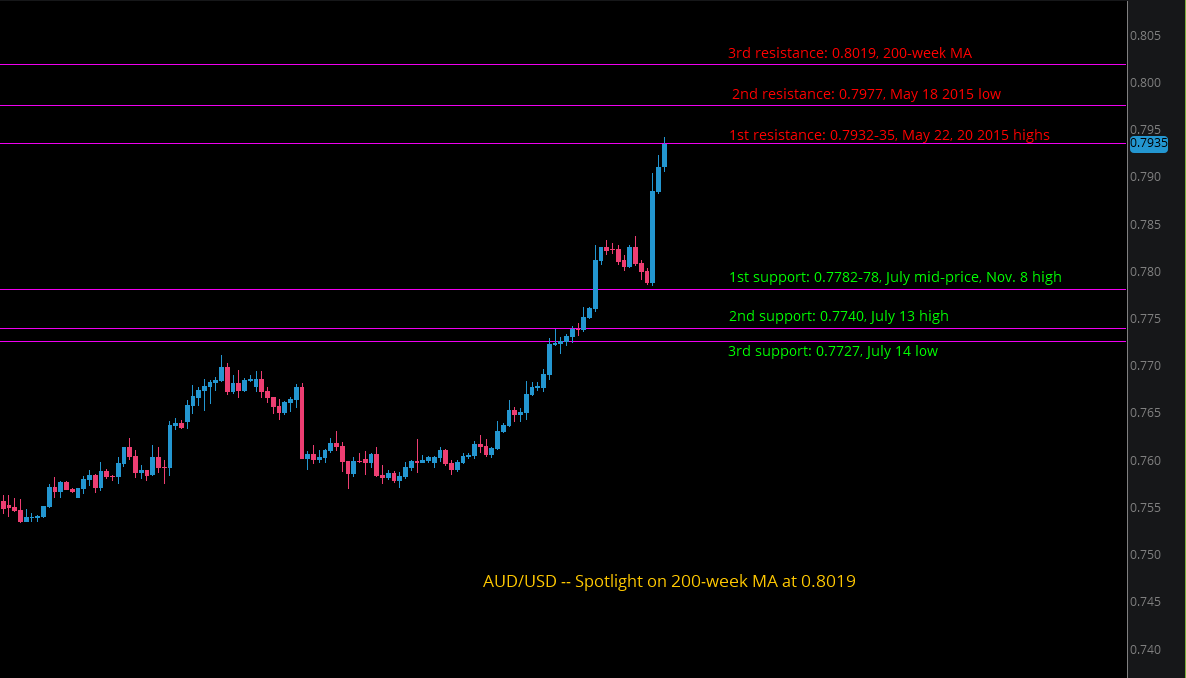
AUD/USD July’s steady uptrend followed by a rally towards two year highs. Now trading at 0.7928.
The recent spike has made the price hit the significant 1st resistance at 0.7932-35 and in case of a breakthrough an advance until the 2nd or 3rd resistance levels could occur at 0.7977 or 0.8019 respectively. The downside risks always apply thus, the 1st support level is set at 0.7782-78 and if breached, the 2nd and 3rd support levels loom side by side at 0.7740 and 0.7727 respectively.
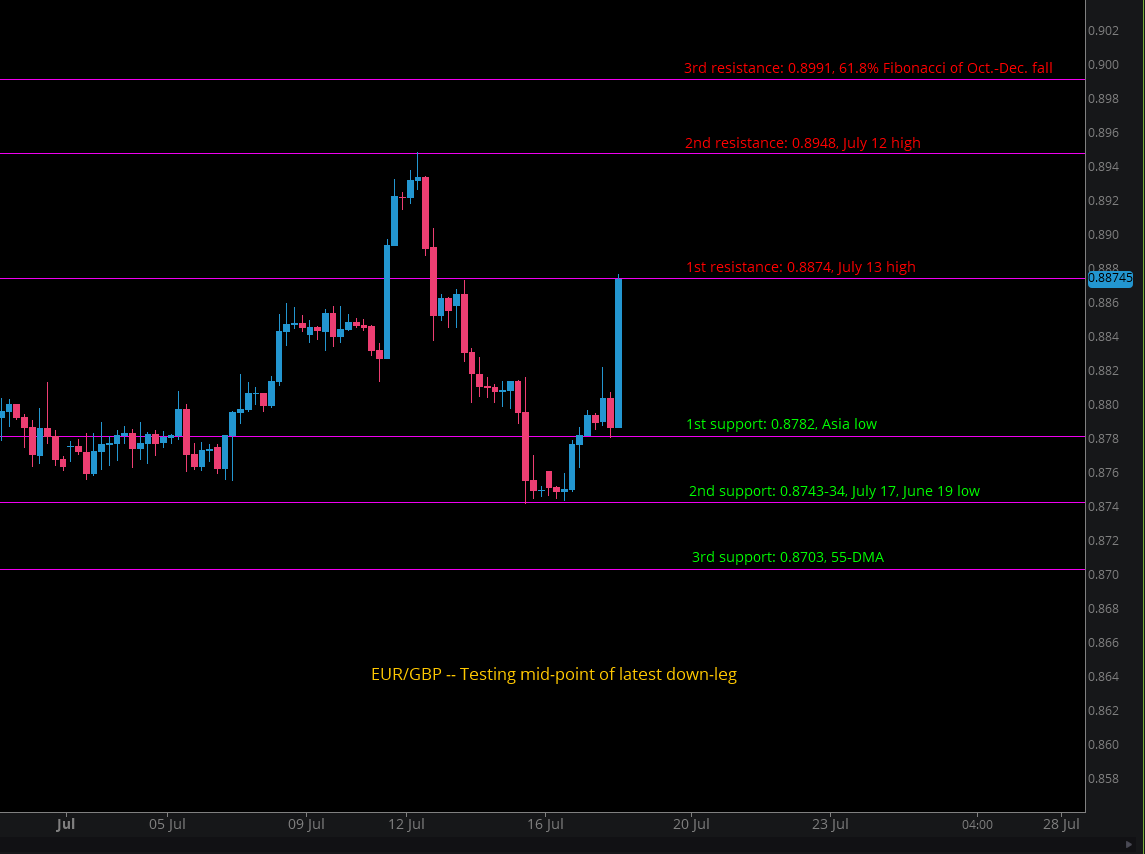
EUR/GBP Market turmoil over the past month has left the pair’s price to a consolidation, latest momentum regains bullish potential. Now trading at 0.8860.
The likely breakout scenario crossing the 1st resistance at 0.8874 could lead to the 2nd resistance at 0.8948. Up higher the 61.8% Fibonacci level looms at 0.8991 as the 3rd resistance. In case of a reversal the chart could stretch lower towards the 1st support at 0.8782 or depreciate lower and hit the 2nd or the 3rd support level at the prices 0.8743-34 or 0.8703.
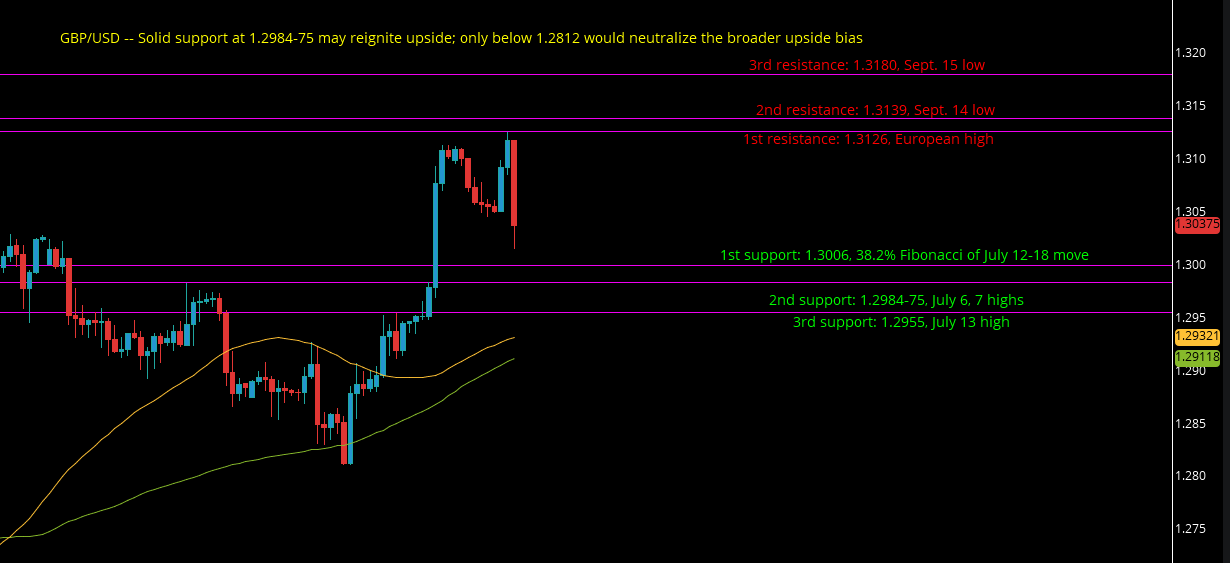
As long as investors are able to withhold 1.2812, the GBP/USD outlook remains bullish.
DESCRIPTION
The pound-dollar failed to test its initial resistance at 1.3126, the European high and now it is trading at 1.3031. The GBP/USD is still skewed to a bullish trend since it is trading above the two moving averages (Green= 100 day moving average, yellow= 50 day moving average). If the pair pushes through the first resistance, the second resistance is on 1.3139, the September 14 low and the last resistance is on 1.3180, the September 15 low. If the chart somehow continues to bleed, we expect the first support on 1.3006, the 38.2% Fibonacci of the July 12-18 move. The second support is on 1.2984, the July 6 high and the last support is on 1.2955, the July 13 high.
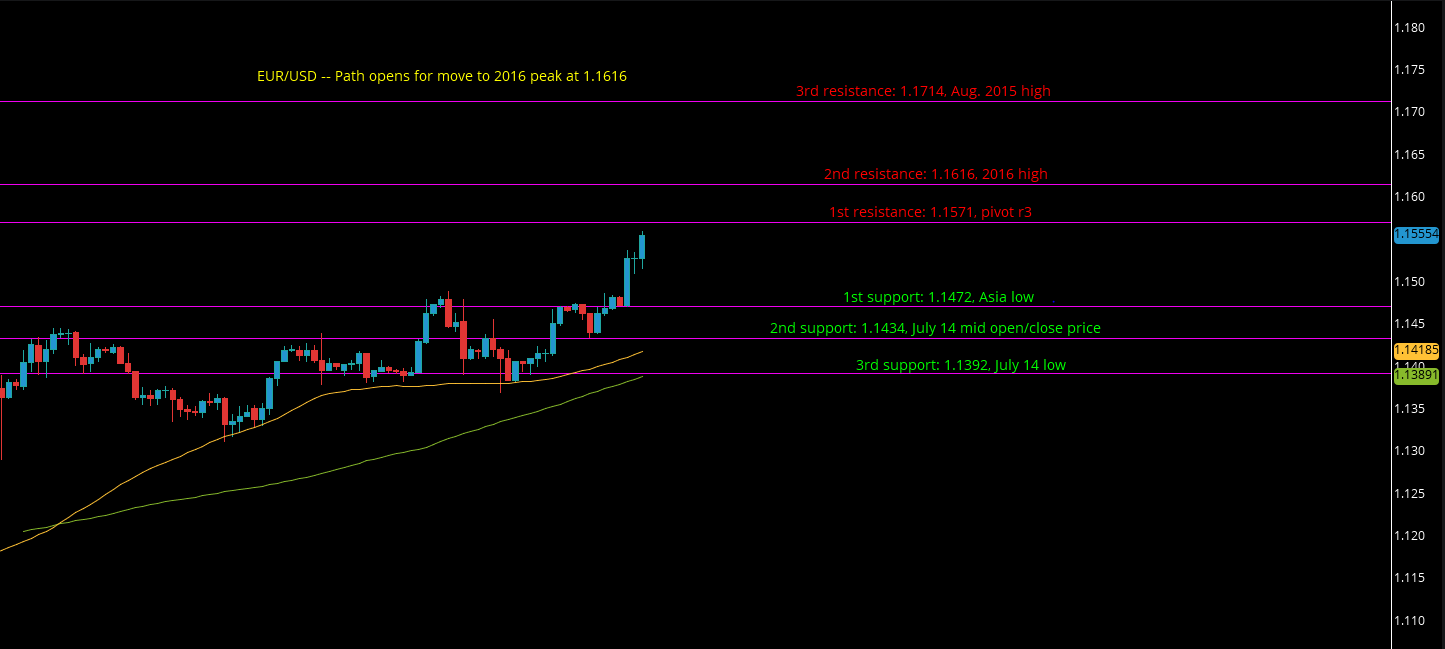
Bullish Doji star shines on the EUR/USD, looking to test on 1.1571.
DESCRIPTION
The EUR/USD is in a bullish mode, we are looking at the first resistance which is on 1.1571, the pivot r3. If the breakout succeeds, the second resistance will be on 1.1616, the 2016 high. The last resistance to release the bulls is on 1.1714, the August 2015 high. If the price reverts its trend, we could see the first support on 1.1472, the Asia low, followed by the second support which is on 1.1434, the July 14 mid-price. The last support is on 1.1392, the July 14 low.


