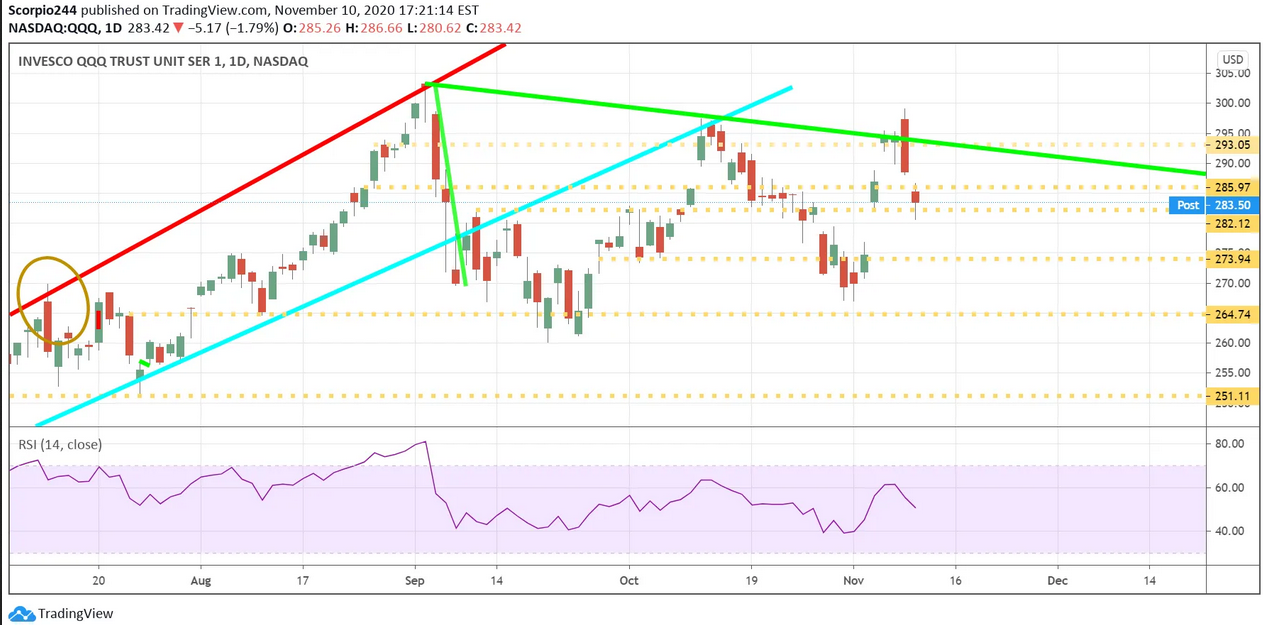
Stocks fell yesterday, with the S&P 500 dropping by 14 bps and the QQQs falling by around 1.8%. Meanwhile, the IWM rose by roughly 1.9%. The big rotation continues for now, with growth-oriented technology names falling sharply and the cyclical pro-economic growth names rising. Typically, this trade has lasted a few days, and then the dip gets too hard for the buyers not to flip back over. But this time could be different.
Look at the ratio of the QQQ to IWM collapsing.
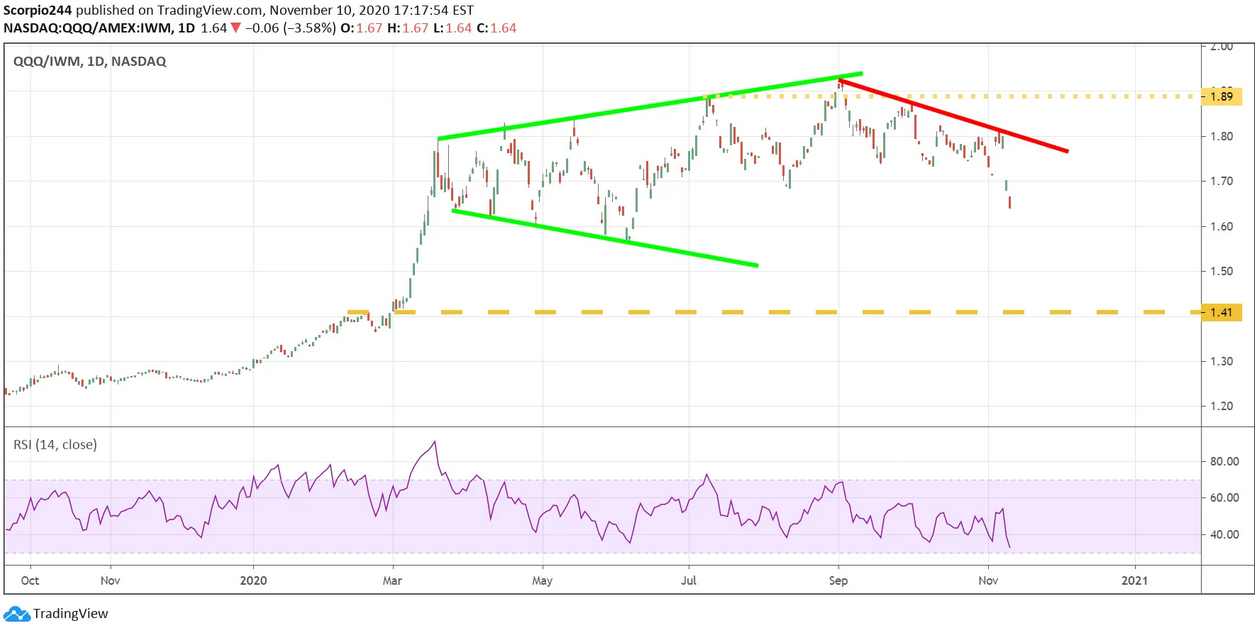
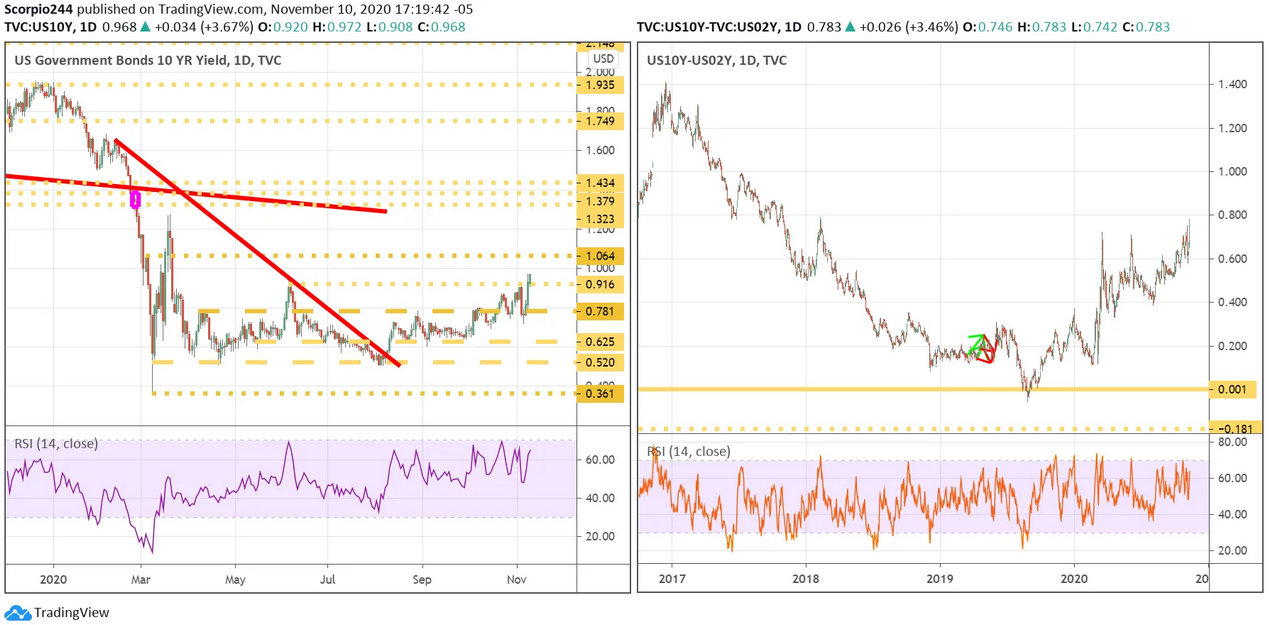
First, the outlook for the virus may have changed for the better, while rates on the 10-year have risen dramatically. The movement of rates may be the most damaging part of the equation, as rising rates pose a threat to some of these growth stocks, supporting their bloated multiples. Remember, the narrative this summer was that the equity risk premium and low rates were making stocks very attractive. Well, now rates are rising, and that can put a big dent in this trade. I’m not saying a 10-year in at 95 bps is high; it is not, but relative to the 50 bps it had been at, it is very high.
The QQQs may have further to fall because there is still a gap to fill around $274.
Zoom
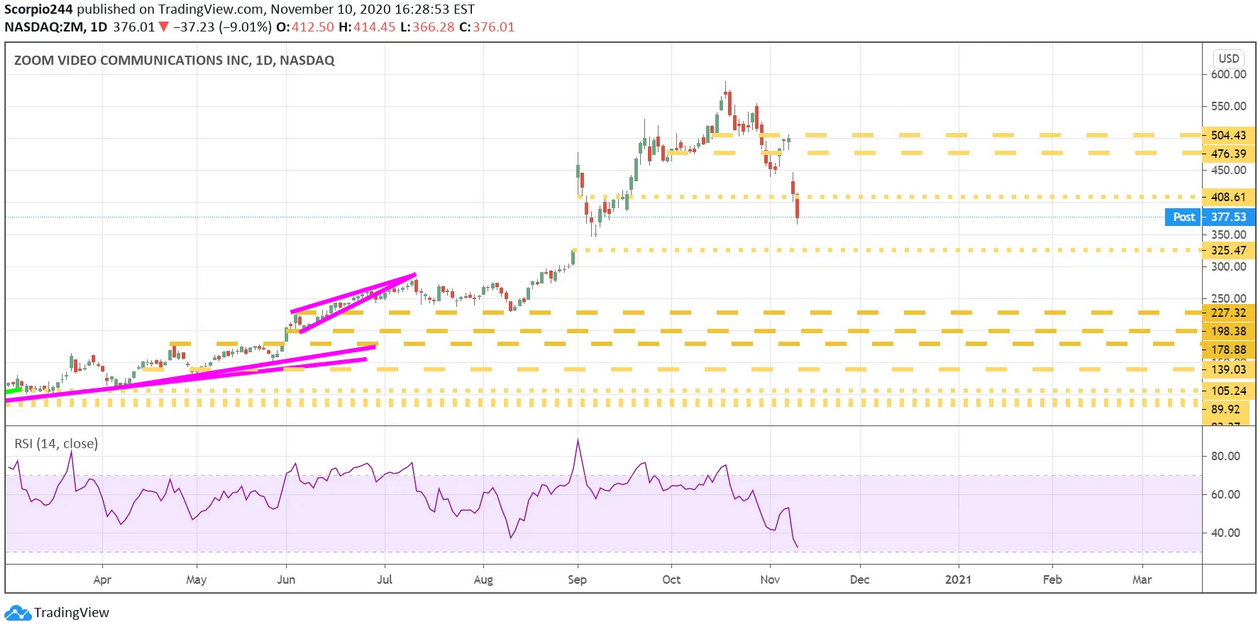
The rotation trade plus rising rates are killing some of the technology winners, like Zoom Video Communications (NASDAQ:ZM), which fell nearly 9% yesterday and is now down about 40% since the middle of October. To think it still trades at 29.9 times 2023 sales estimates after the drop. You realize that analysts estimate revenue of $3.9 billion in revenue for the company, in the year 2023. For this stock to trade at 10 times 2023 sales, it would need revenue of $11.7 billion or almost 3 times more than what analysts are currently estimates. Either analysts’ are clueless or the market is way off-base.
Don’t be surprised to see $325 soon.
AMD
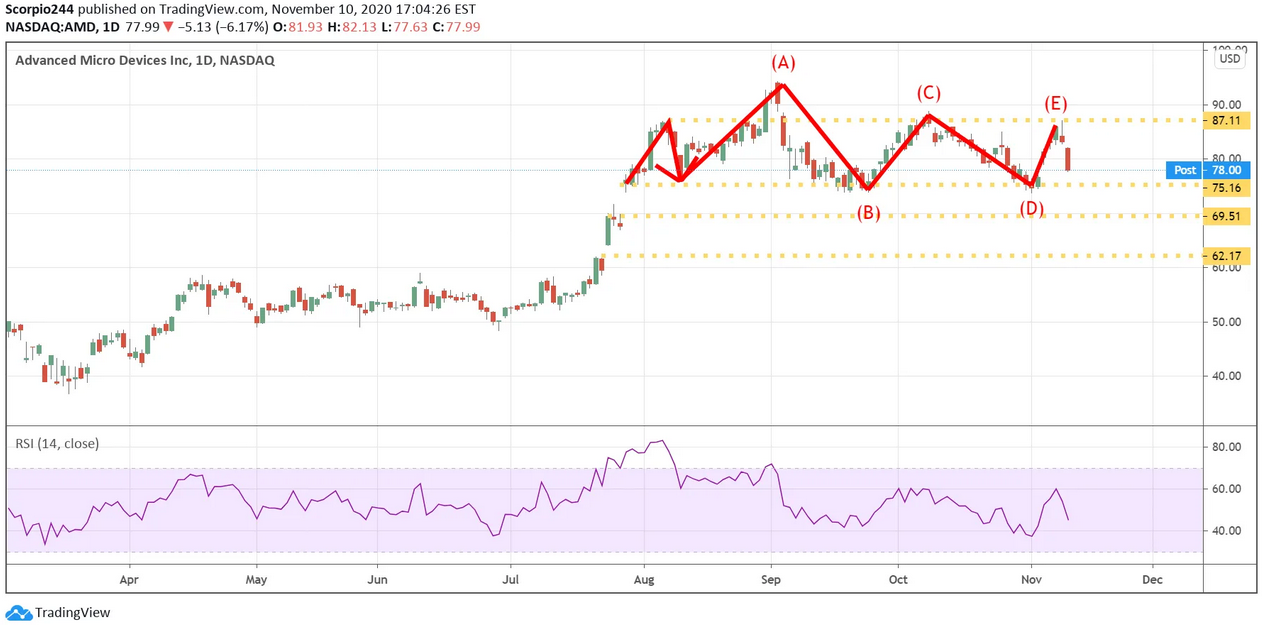
So again, I have no idea why Xilinx (NASDAQ:XLNX) agreed to do an all-stock deal with AMD. Maybe for tax purposes, but the stock is now less than the day the deal was announced. Pretty soon, it will probably be worth even less because AMD is like an anchor falling to the bottom of the ocean dragging the boat with it. Again, $75 is the big level of support for AMD and the RSI continues to trend lower, suggesting lower prices lie ahead.
Chipotle
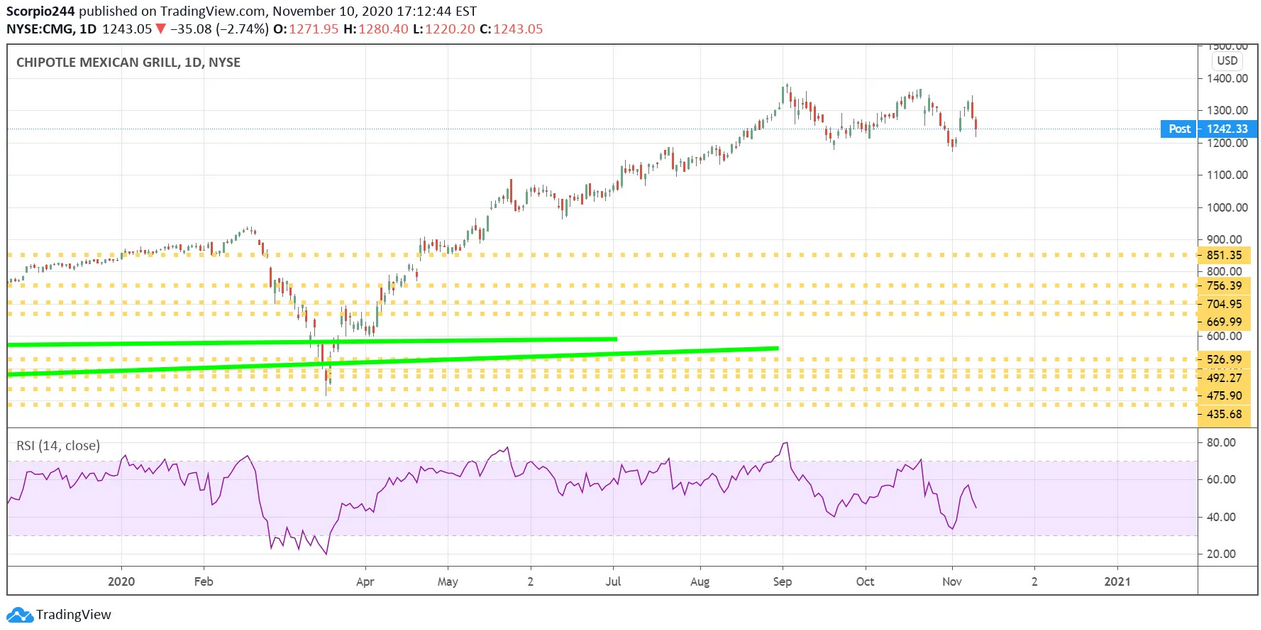
It isn’t just the usual cast of characters I like to beat upon either. Chipotle (NYSE:CMG) was also hit hard the past few days, and it too has a pretty nasty triple top pattern forming, with a drop below $1170, sealing the deal and sending shares even lower.
JPMorgan
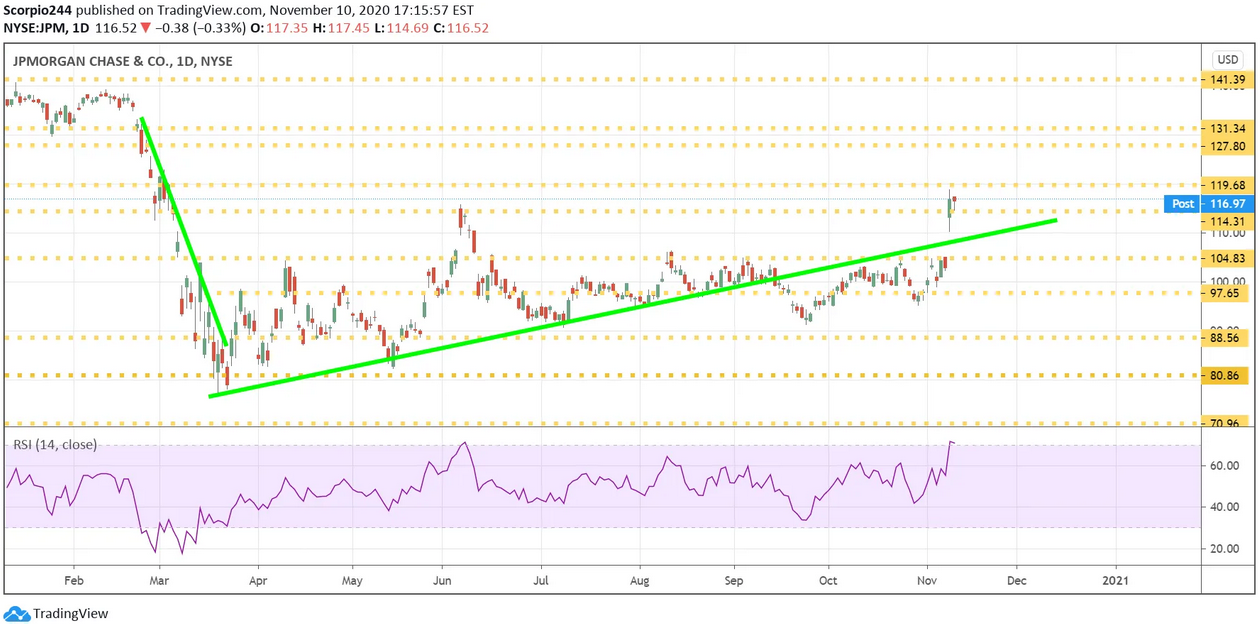
But not all stocks will get smashed if rates rise. In fact, the banks should benefit, and the nice thing is that spreads are widening dramatically. In fact, widening spreads on the yield curve is probably the thing we want to see support a positive growth outlook. That will help the banks. JPMorgan (NYSE:JPM) is likely a little bit ahead of itself here but could do quite well going forward.
