Get 40% Off
These stocks are up over 10% post earnings. Did you spot the buying opportunity? Our AI did.Read how

Tech Indices Finally Succumb To Large Cap Selling

Published 03/28/2018, 12:20 AM
Updated 07/09/2023, 06:31 AM

The media blamed Facebook (NASDAQ:FB) for yesterday's woes but really the damage was done in January when Large Cap indices sold off. Yesterday was the turn of profit takers to take a shot at those high flying Tech Indices.

Markets still are a long way from the oversold conditions of February 2016, November 2011 and October 2008—tracked in the tables at the end of this post. I'll let you know when you get there and you can back up the truck for those long-term investment opportunities when it happens. However, my #sectorbreadth analysis is showing near-term buying opportunities.

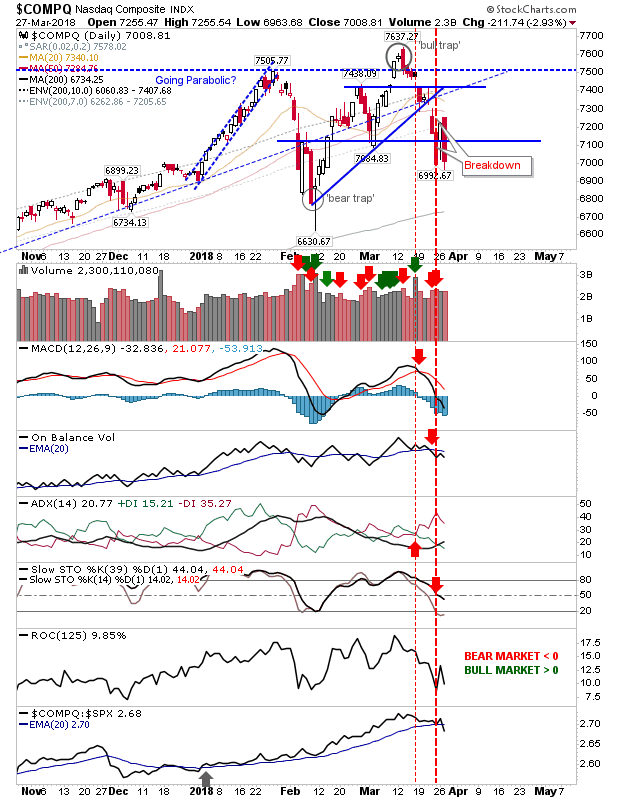
Of the indices, Monday's little rally looks to have caught out some over-eager buyers, some of whom may have bailed already. For the NASDAQ and NASDAQ 100 there was a big hit with a wipeout of Monday's gains but volume didn't rank as distribution despite the extent of losses. Technicals, did however, turn net bearish.
COMPQ Daily Chart


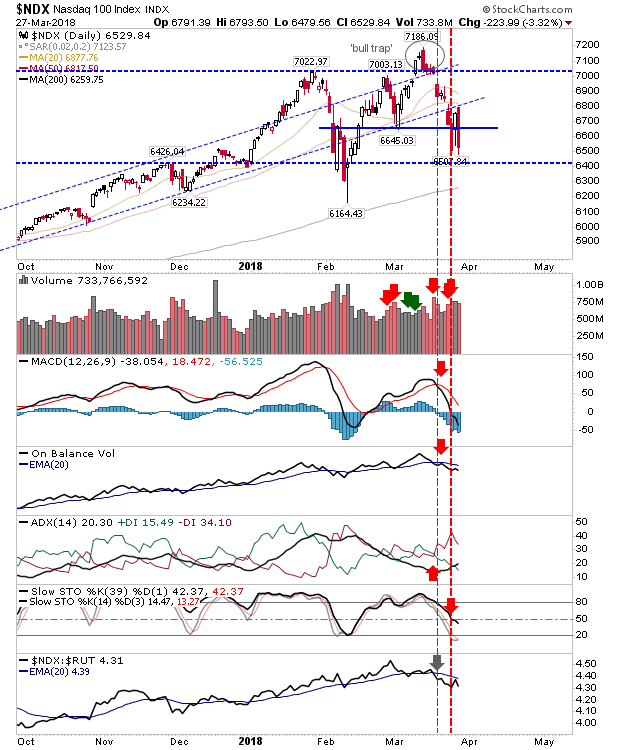
The NASDAQ 100 took the biggest hit of the two Tech Indices but it didn't finish at a support level; today could see another swing lower to the 200-day MA as occurred in Large Caps earlier in the week.
NDX Daily Chart


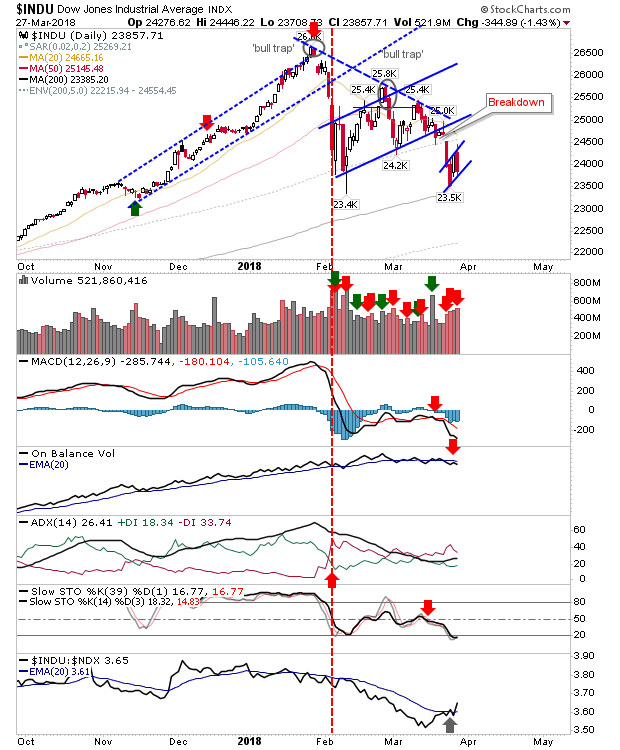
Speaking of Large Caps, support from the 200-day MAs is fading fast and technicals are not suggesting a quick bounce. The Dow Jones index looks to be mapping a bearish flag and unlike Tech Indices there was confirmed bearish distribution.
INDU Daily Chart


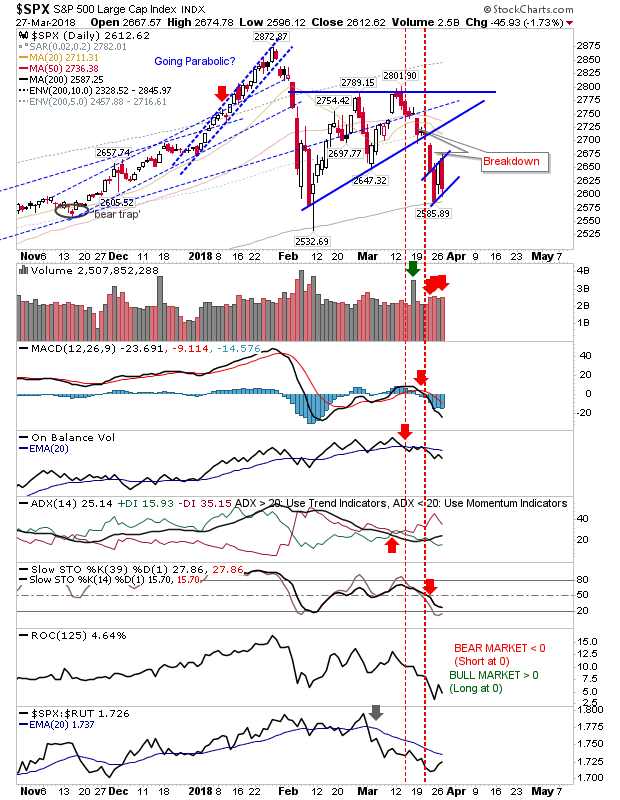
The S&P is also mapping a bearish 'flag' on higher volume distribution. Unlike the Dow Jones, Stochastics are not oversold, suggesting this index is likely to cut below its 200-day first.
3rd party Ad. Not an offer or recommendation by Investing.com. See disclosure here or remove ads .

SPX Daily Chart


Of the indices, the Russell 2000 had a relatively low key day. The 2% loss actually registered as a relative gain against its peers (Tech and Large Caps). If there is going to be a recovery then the Russell 2000 could be the index to lead the broader indices out.
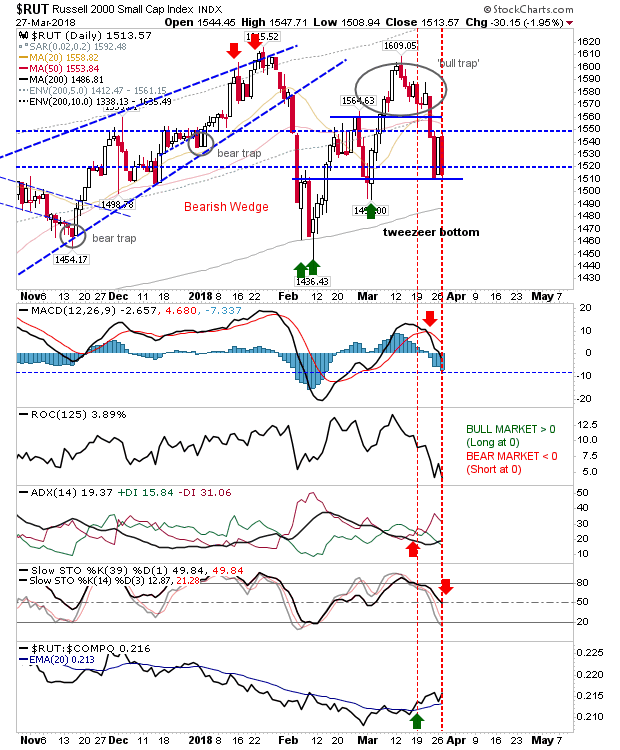
RUT Daily Chart


For today, if sellers maintain control at the open then look for Large Caps to undercut their 200-day MAs (and likely deliver an acceleration in the selling). If buyers can bring things back, then the Russell 2000 will be the index to play for a bounce; also look to my #sectorbreadth analysis for sector SPDR plays.
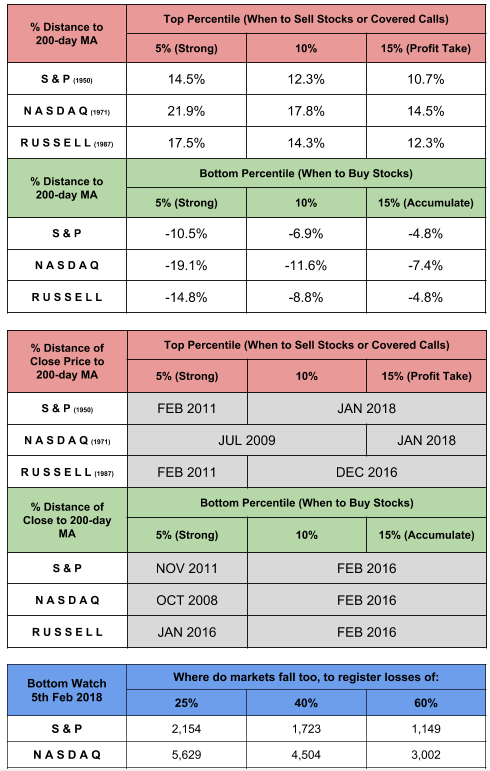
Major Indices Stats

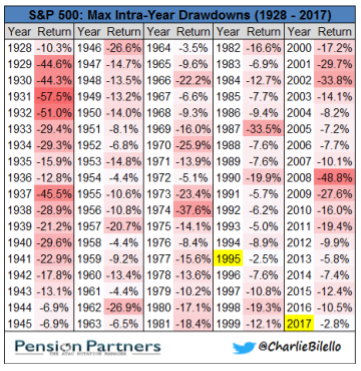
SPX Max Intra-Year Drawdowns

Latest comments

Risk Disclosure: Trading in financial instruments and/or cryptocurrencies involves high risks including the risk of losing some, or all, of your investment amount, and may not be suitable for all investors. Prices of cryptocurrencies are extremely volatile and may be affected by external factors such as financial, regulatory or political events. Trading on margin increases the financial risks.
Before deciding to trade in financial instrument or cryptocurrencies you should be fully informed of the risks and costs associated with trading the financial markets, carefully consider your investment objectives, level of experience, and risk appetite, and seek professional advice where needed.
Fusion Media would like to remind you that the data contained in this website is not necessarily real-time nor accurate. The data and prices on the website are not necessarily provided by any market or exchange, but may be provided by market makers, and so prices may not be accurate and may differ from the actual price at any given market, meaning prices are indicative and not appropriate for trading purposes. Fusion Media and any provider of the data contained in this website will not accept liability for any loss or damage as a result of your trading, or your reliance on the information contained within this website.
It is prohibited to use, store, reproduce, display, modify, transmit or distribute the data contained in this website without the explicit prior written permission of Fusion Media and/or the data provider. All intellectual property rights are reserved by the providers and/or the exchange providing the data contained in this website.
Fusion Media may be compensated by the advertisers that appear on the website, based on your interaction with the advertisements or advertisers.
© 2007-2024 - Fusion Media Limited. All Rights Reserved.