Get 40% Off
🤯 Perficient is up a mind-blowing 53%. Our ProPicks AI saw the buying opportunity in March.Read full update

Synchrony Financial Draws Bullish Elliott Wave Pattern

Published 04/01/2019, 05:42 AM
Updated 07/09/2023, 06:31 AM

Synchrony Financial (NYSE:SYF) spun off from General Electric (NYSE:GE) less than five years ago, but its shareholders have already experienced plenty of market turbulence on their own. 2018, for example, was nothing to brag about. The stock plunged from an all-time high of $40.59 in January to as low as $21.78 in late December.

And as it often happens, the best gains in the stock market come to those who have the courage to buy after a big selloff. Synchrony Financial stock closed at $31.90 last month, up over 46% from the December low. The Elliott Wave structure of this rally is of big interest to us.
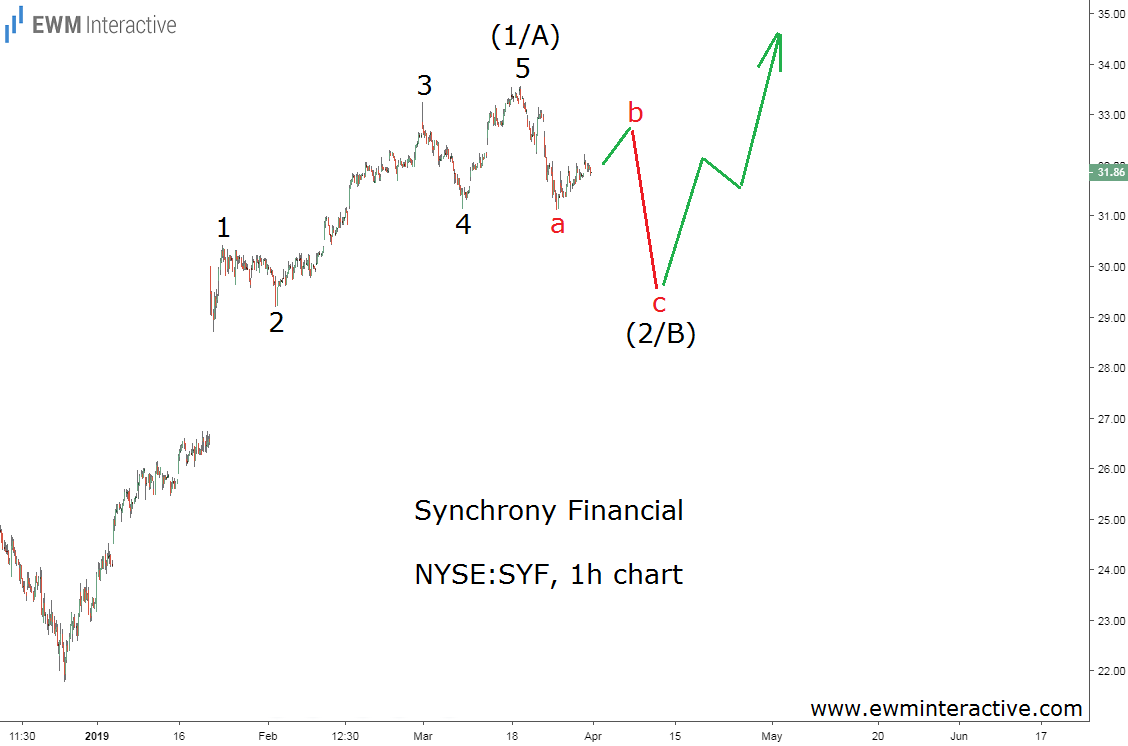
Synchrony Financial

The 1-hour chart of SYF stock reveals that the surge from $21.78 to $33.56 is a textbook five-wave impulse. Wave 1 is extended, but wave 3 is still longer than wave 5, so there is no violation of the rule stating that wave 3 cannot be the shortest among waves 1, 3 and 5.

Synchrony Financial Looks Strong

According to the Wave theory, impulses point in the direction of the larger trend. This means that once the corresponding three-wave pullback in wave (2/B) is over, the bulls can be expected to return in wave (3/C). In the long run, we would not be surprised to see Synchrony Financial near $40 a share again.

Besides, it is not just Elliott Wave analysis that makes this stock look promising. Synchrony is the leading provider of private label credit cards in the United States. The company is consistently profitable, conservatively financed and growing. Its 2018 price to earnings ratio of 8.5 suggests it is undervalued, as well.

3rd party Ad. Not an offer or recommendation by Investing.com. See disclosure here or remove ads .

Technical and fundamental analysis don’t always point in the same direction, but when they do, it is a risk worth taking.

Original post

Latest comments

Risk Disclosure: Trading in financial instruments and/or cryptocurrencies involves high risks including the risk of losing some, or all, of your investment amount, and may not be suitable for all investors. Prices of cryptocurrencies are extremely volatile and may be affected by external factors such as financial, regulatory or political events. Trading on margin increases the financial risks.
Before deciding to trade in financial instrument or cryptocurrencies you should be fully informed of the risks and costs associated with trading the financial markets, carefully consider your investment objectives, level of experience, and risk appetite, and seek professional advice where needed.
Fusion Media would like to remind you that the data contained in this website is not necessarily real-time nor accurate. The data and prices on the website are not necessarily provided by any market or exchange, but may be provided by market makers, and so prices may not be accurate and may differ from the actual price at any given market, meaning prices are indicative and not appropriate for trading purposes. Fusion Media and any provider of the data contained in this website will not accept liability for any loss or damage as a result of your trading, or your reliance on the information contained within this website.
It is prohibited to use, store, reproduce, display, modify, transmit or distribute the data contained in this website without the explicit prior written permission of Fusion Media and/or the data provider. All intellectual property rights are reserved by the providers and/or the exchange providing the data contained in this website.
Fusion Media may be compensated by the advertisers that appear on the website, based on your interaction with the advertisements or advertisers.
© 2007-2024 - Fusion Media Limited. All Rights Reserved.