The Riksbank met earlier today and left rates unchanged at 0%, as expected. Sweden’s central bank was one of the first to exit from negative rates at their last meeting on December 19, 2019. Members said that inflation and growth are in-line with previous expectations, however they did note that inflation may be lower than previously forecast due to falling energy prices. They also noted that rates will remain at 0% for the forecast period. (Lower for longer)
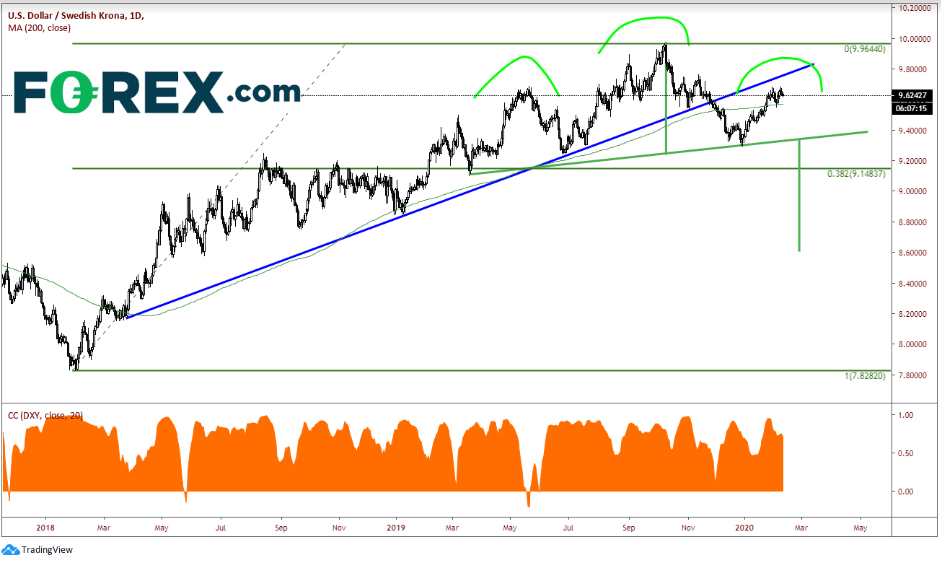
USD/SEK has been trading in an uptrend since early 2018 from a low of 7.7282 to October 2019 highs at 9.9644. Price broke lower through the upward sloping triangle to 9.2942 on December 31 and bounced. USD/SEK appears to be trying to put in the right shoulder of a head-and-shoulders formation, as it is near the underside of the previously mentioned trendline, which comes across near 9.7500. It is also trading slightly above the 200-day moving average, which comes across near 9.5691. Although this is a bit premature, if price does indeed trade lower and forms a head-and-shoulders pattern, the price target would be somewhere near 8.6000, depending on where price breaks the neckline.

Source: Tradingview, FOREX.com
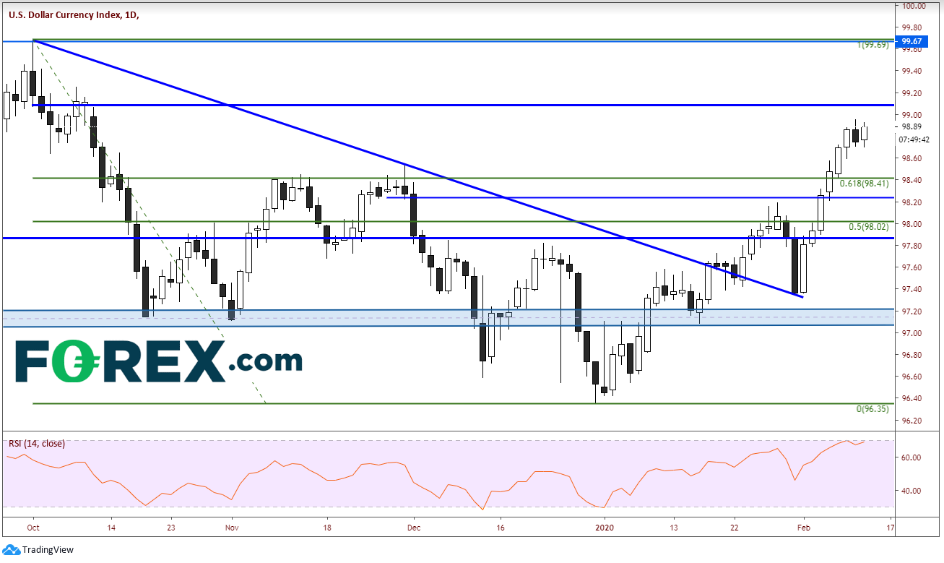
USD/SEK is often used as a predictor of the U.S. dollar. Currently, the correlation coefficient has moved off its highs near .96 to .70. A correlation coefficient of +1.00 means that the two assets are perfectly correlated and move together 100% of the time. A correlation coefficient of -1.00 means that the two assets are perfectly uncorrelated and move in opposite directions 100% of the time. If USD/SEK does move lower, and its correlation coefficient remains at current levels or better, then the DXY may reverse its current strong move higher and begin to move lower as well.

Source: Tradingview, FOREX.com
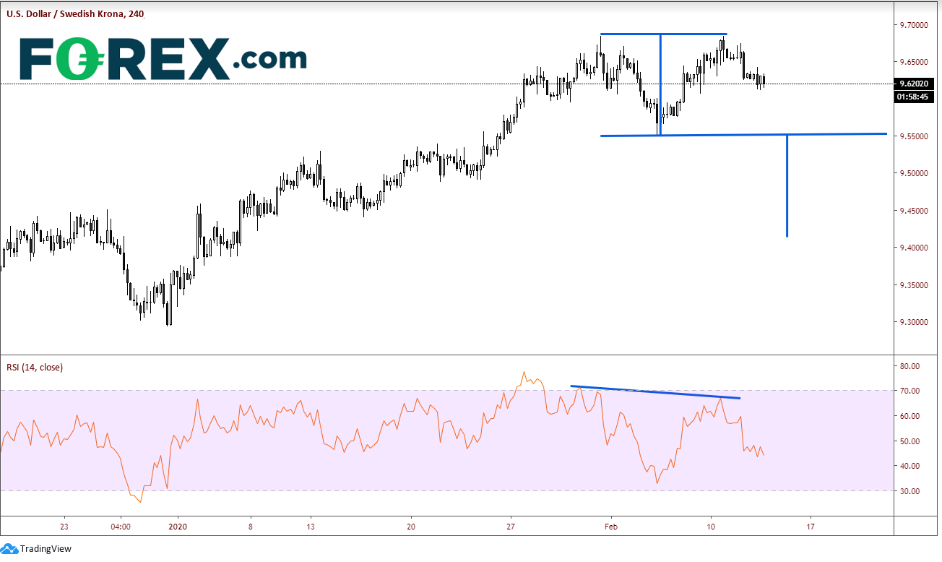
In addition, on a 240-minute timeframe, price has been moving lower from recent highs near 9.6844. If price continues lower and takes out the February 5 lows near 9.5502, USD/SEK will form a double top. The price target will be near 9.4100.

Source: Tradingview, FOREX.com
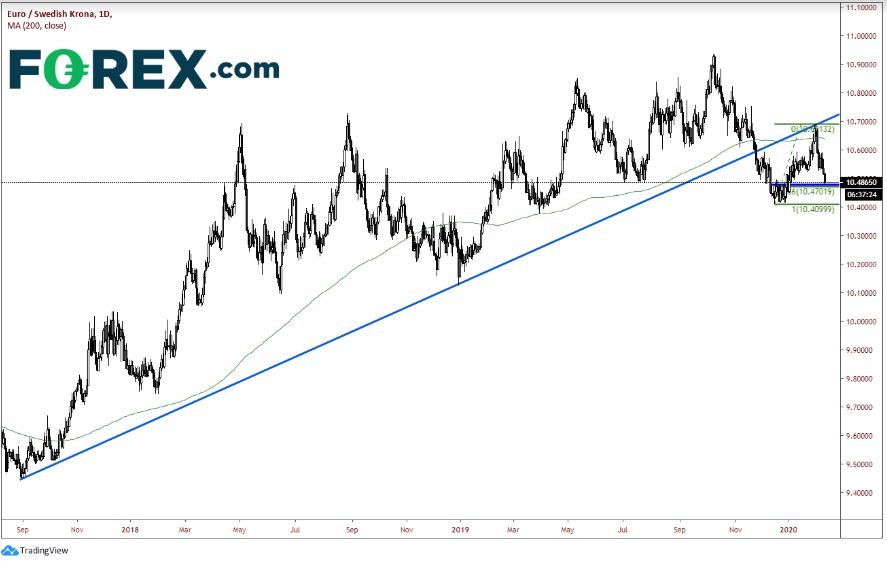
EUR/SEK had been trading higher to start the year. During the month of January, price moved from 10.4319 up to trendline resistance on January 31 at 10.6900. The month of February has not been too kind to the euro complex in general, as price has given back 78.6% of that move to near 10.4700. There is also horizontal support in that area. If price breaks below 10.4700, the next stop could be previous lows near 10.4100.

Source: Tradingview, FOREX.com
As the Riksbank has indicated that they are on hold for a while at 0%, watch for the possibility of USD/SEK and EUR/SEK to move lower just based on interest-rate differential expectations in general. However, when you add in the possible technicals shown above, it makes for a stronger case for bears.
