
My children grew up reading a Series of Unfortunate Events by Lemony Snicket’s (the pseudonym for Daniel Handler). The award winning 13 book series began at the turn of the century (1999) with the Bad Beginning and seven years later, Handler ended the stories with The End (2006). The books chronicle the stories of three orphaned children (Violet, Klaus, and Sunny Baudelaire) who experience increasingly terrible events after the alleged death of their parents and burning of their house by a man named Count Olaf.
Crime, violence and hardships not only occur in novels, but also in real life. Stock market investors are no strangers to unfortunate events either. Within the last five years alone, investors have endured an endless stream of bad news, including the following:
- Flash Crash
- Debt Ceiling Debate
- U.S. Debt Downgrade
- European Recession
- Arab Spring
- Potential Greek Exit from EU
- Uncertain U.S. Presidential Elections
- Sequestration
- Cyprus Financial Crisis
- Tax Increases
- Fed Talks of Stimulus Tapering
- Syrian Civil War / Military Threat
- Gov. Shutdown
- Obamacare Rollout Glitches
- Iranian Nuclear Threat
This is only a partial list, but wow, this never ending crises list sounds pretty ominous, right? I wonder how stocks have fared amidst this horrendous avalanche of negative headlines? The short answer is stocks are up a whopping +170% since the March 2009 lows as measured by the S&P 500 index, and would be significantly higher once accounting for reinvested dividends. A bit higher return than your CD, money market, or savings account rate.
As you can see from the chart above, the gargantuan returns achieved over this period have not occurred without some volatility. Investors have consumed massive quantities of Tums during the five highlighted corrections (averaging -13%) to counteract all the heartburn. As I’ve written in the past, with higher risk comes higher rewards. Those investors who cannot stomach the volatility shouldn’t go cold turkey on stocks though, but rather diversify their holdings and reduce the portfolio equity allocation to a more palatable level.
Doubting Thomases
Many people I bump into remain “Doubting Thomases” as it relates to the stock market recovery and they expect an imminent crash. Certainly, the rocket-like trajectory of the last year (and five years) is not sustainable, and historically stocks correct significantly twice a decade – equal to the number of recessions occurring each decade. There is no denying that this economic recovery has been the slowest since World War II, but could this be good news? From the half-full glass lens, a slower recovery may actually equate to a longer recovery.
Just like skeptical investors, business executives have been slow to hire and slow to accelerate spending as well. Typically business cycles come to an end when overinvestment happens – recall the 2000 tech bubble and 2007 housing bubble. There may be pockets of investment bubbles (e.g., Twitter Inc [TWTR] and other money-losing speculative stocks), but as you can see from the chart below, corporate profits have skyrocketed and are at record highs. It should therefore come as no surprise that record profits have coincided with record stock prices (see also It’s the Earnings Stupid)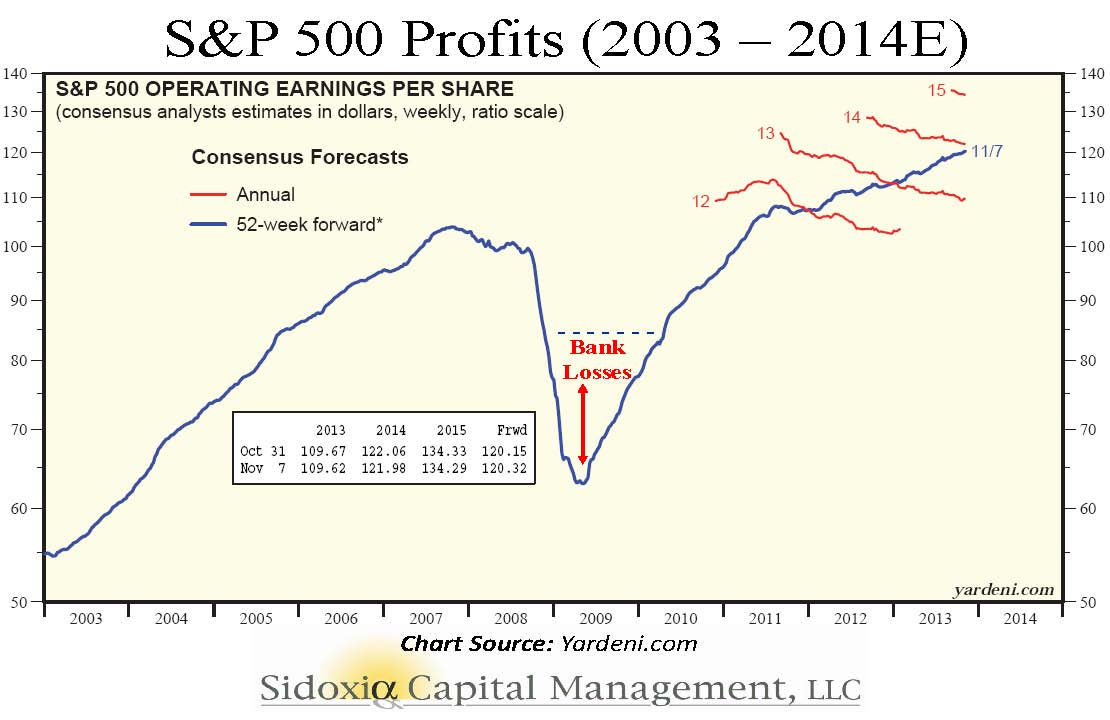
Over the period of 2003-2013 stock prices largely followed the slope of earnings, and excluding the enormous losses in the banking sector, non-financial stocks suffered much less.
History is on Your Side
If you are in the camp that says this last five years has been an anomaly, history may beg to differ. Over the last 50 years we have experienced wars, assassinations, currency crises, banking crises, terrorist attacks, recessions, SARs, mad cow disease, military engagements, tax hikes, Fed rate hikes, and yes, even political gridlock. As the chart below shows, the stock market is volatile over the short-run, but quite resilient and lucrative over the long-run (+6,863% over 49 years). In fact, from January 1960 to October 2013 the S&P 500 index has catapulted +14,658%, including reinvested dividends (Source: DQYDJ.net). 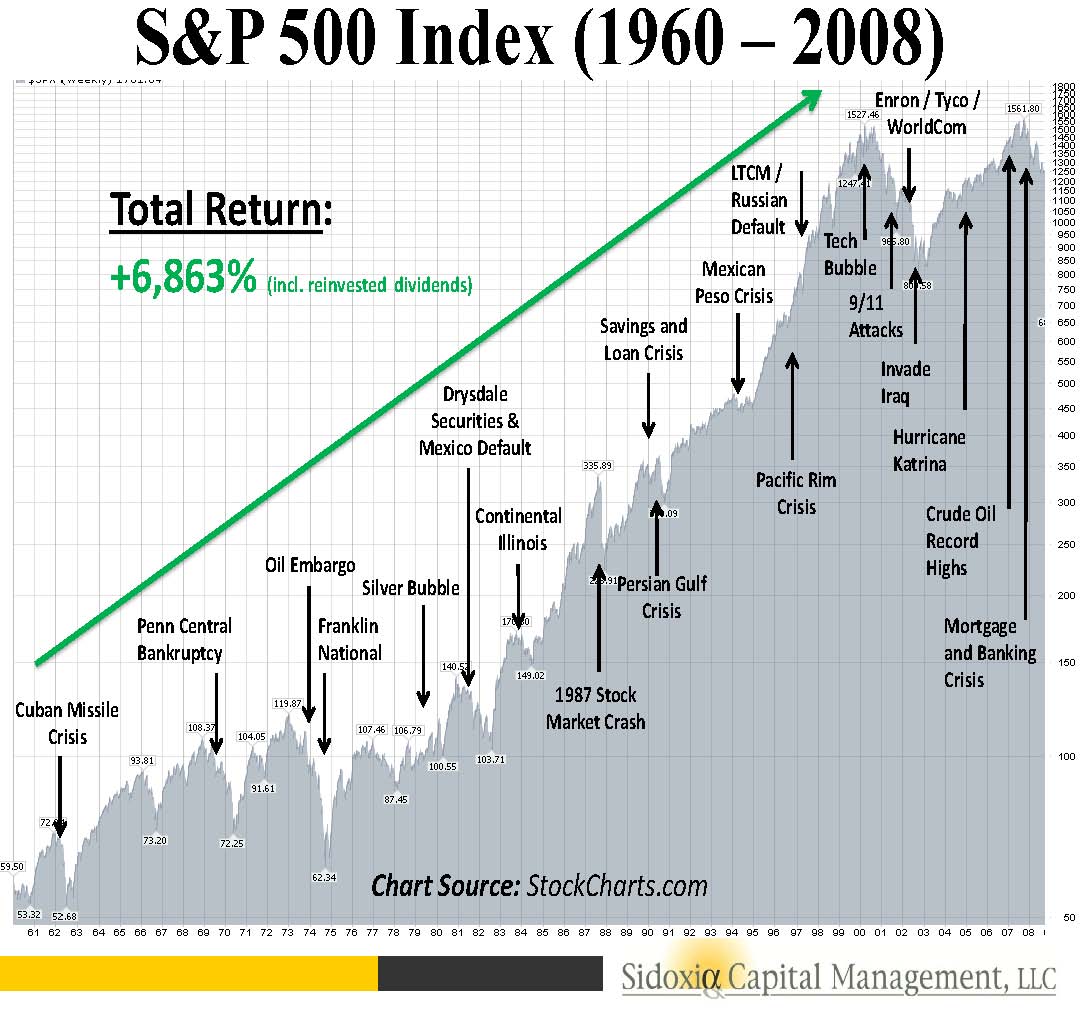
DISCLOSURE: Sidoxia Capital Management (SCM) and some of its clients hold positions in certain exchange traded funds (ETFs), but at the time of publishing SCM had no direct position in TWTR, or any other security referenced in this article. No information accessed through the Investing Caffeine (IC) website constitutes investment, financial, legal, tax or other advice nor is to be relied on in making an investment or other decision.