With baby boomers being one of the biggest population bubbles, medical suppliers can be a healthy addition to a portfolio. Here are five medical supply companies that are trading below their normal historical PE ratios and inline or slightly below their estimated growth rates. Consequently, they represent an opportunity for above-average growth and yield.
Five Medical Suppliers Portfolio Review
The following table summarizes five medical suppliers that appear to be attractively valued, and lists them in order of dividend yield highest to lowest. From left to right, the table shows the company’s stock symbol and name. Next, two valuation metrics are listed side-by-side, the current PE ratio followed by the historical normal PE ratio for perspective. Then the estimated EPS growth, 15-year historical EPS growth and the 5-year estimated annual total return providing a perspective of the past versus the future growth potential of each company. The final three columns show the current dividend yield, the company sector and its market cap.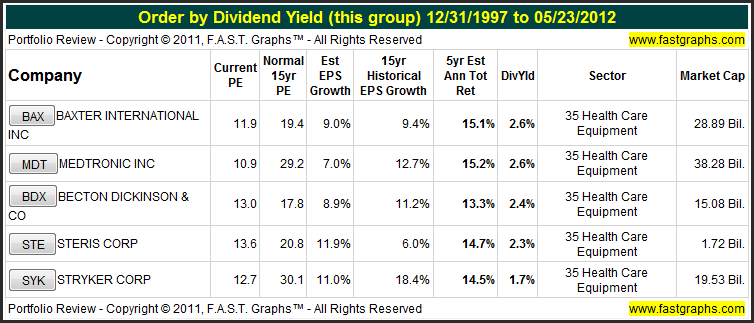
A Closer Look at the Past and the Future Potential
Since a picture is worth 1,000 words, we’ll take a closer look at the past performance and future potential of each of our five candidates through the lens of F.A.S.T. Graphs™.
Earnings Determine Market Price: The following earnings and price correlated historical graphs clearly illustrates the importance of earnings. The Earnings Growth Rate Line or True Worth™ Line (orange line with white triangles) is correlated with the historical stock price line. On graph after graph the lines will move in tandem. If the stock price strays away from the earnings line (over or under), inevitably it will come back to earnings. The historical normal PE ratio line (dark blue line with*) depicts a PE ratio that the market has historically applied.
The orange True Worth™ line and the blue normal PE ratio line provide perspectives on valuation. The orange line reflects the fair value of each company’s earnings relative to its growth rate achievement, and the blue line reflects how the market has traditionally valued the company’s stock relative to its fair value. The blue line represents a trimmed historical normal PE ratio (the highest and lowest PEs are trimmed). These lines should be viewed as barometers or aids for ascertaining sound buy, sell or hold decisions. Rather than seen as absolutes, they should be seen as guides to better thinking.
“Baxter International Inc., through its subsidiaries, develops, manufactures and markets products that save and sustain the lives of people with hemophilia, immune disorders, infectious diseases, kidney disease, trauma, and other chronic and acute medical conditions. As a global, diversified healthcare company, Baxter applies a unique combination of expertise in medical devices, pharmaceuticals and biotechnology to create products that advance patient care worldwide.”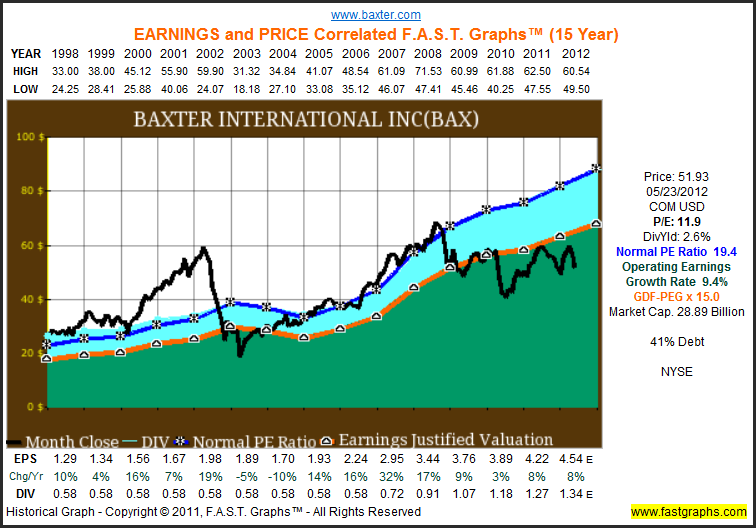
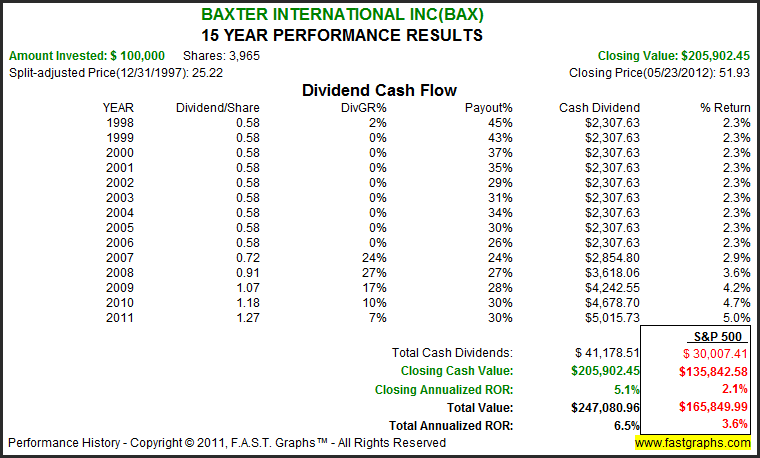
The consensus of 21 leading analysts reporting to Capital IQ forecast Baxter International Inc’s long-term earnings growth at 9%. Baxter International Inc has medium long-term debt at 41% of capital. Baxter International Inc is currently trading at a P/E of 11.9, which is below the value corridor (defined by the five orange lines) of a maximum P/E of 18. If the earnings materialize as forecast, Baxter International Inc’s True Worth™ valuation would be $104.39 at the end of 2017, which would be a 15.1% annual rate of return from the current price.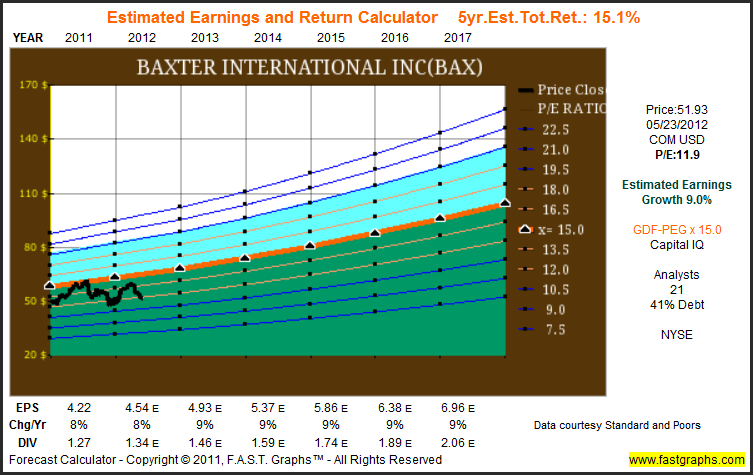
“Medtronic, Inc. (www.medtronic.com), headquartered in Minneapolis, is the global leader in medical technology – alleviating pain, restoring health and extending life for millions of people around the world.” 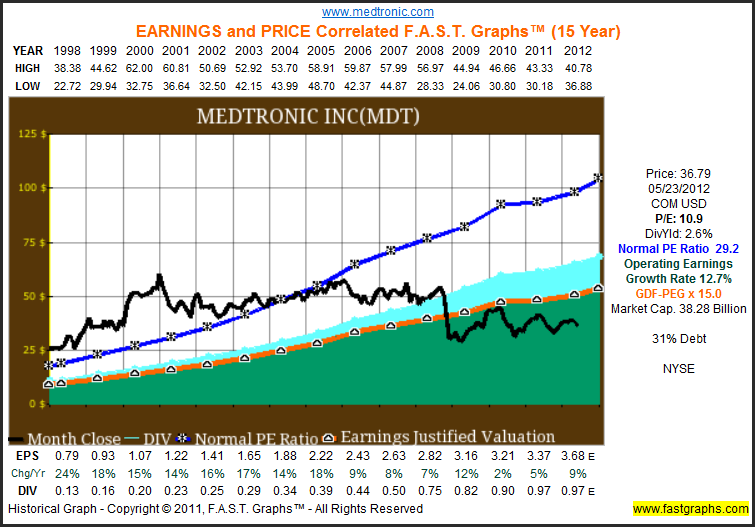
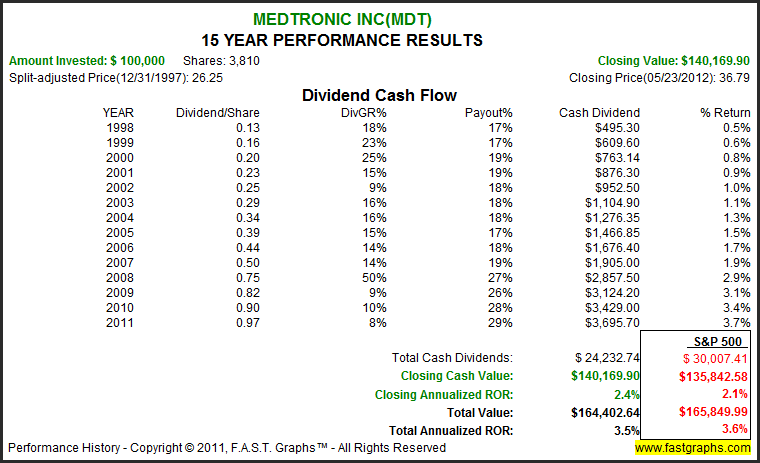
The consensus of 28 leading analysts reporting to Capital IQ forecast Medtronic Inc’s long-term earnings growth at 7%. Medtronic Inc has medium long-term debt at 31% of capital. Medtronic Inc is currently trading at a P/E of 10.9, which is below the value corridor (defined by the five orange lines) of a maximum P/E of 18. If the earnings materialize as forecast, Medtronic Inc’s True Worth™ valuation would be $77.42 at the end of 2017, which would be a 15.2% annual rate of return from the current price.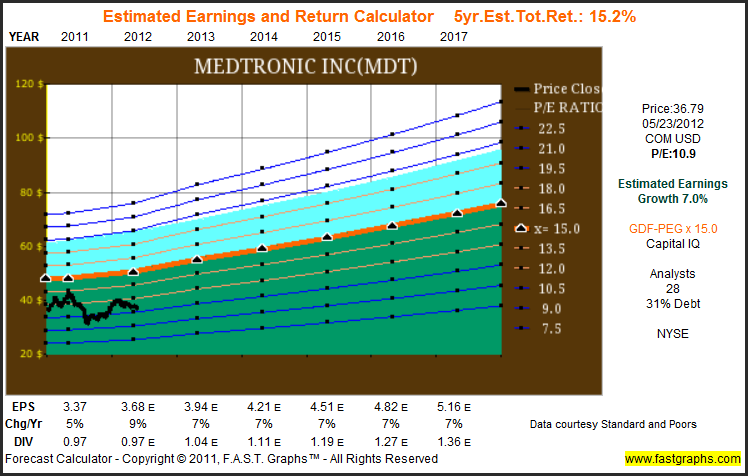
“BD, a leading global medical technology company that manufactures and sells medical devices, instrument systems and reagents, is dedicated to improving people’s health throughout the world. BD is focused on improving drug therapy, enhancing the quality and speed of diagnosing infectious diseases, and advancing research and discovery of new drugs and vaccines. The Company’s capabilities are instrumental in combating many of the world’s most pressing diseases. Founded in 1897 and headquartered in Franklin Lakes, New Jersey, BD employs approximately 29,000 associates in more than 50 countries throughout the world. The Company serves healthcare institutions, life science researchers, clinical laboratories, industry and the general public.” 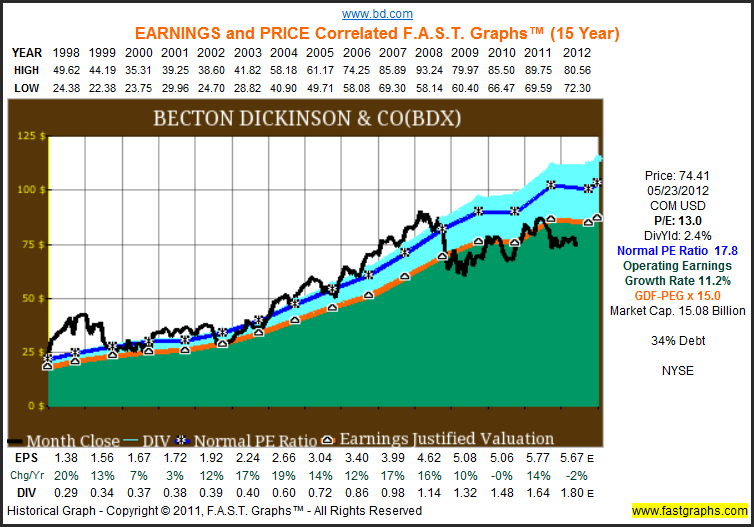
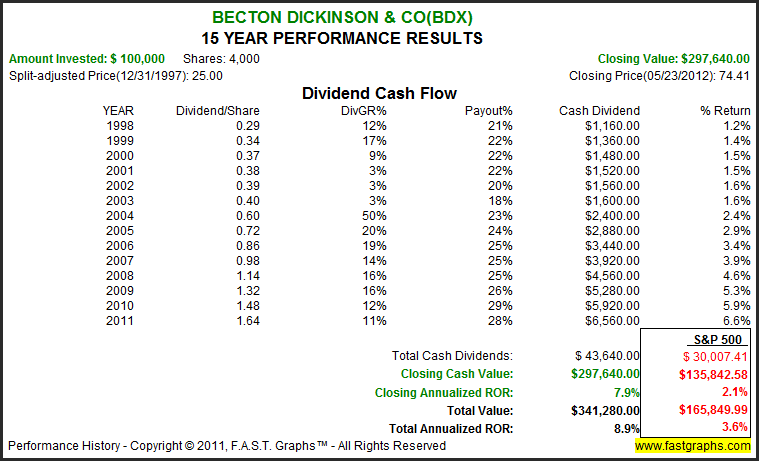
The consensus of 21 leading analysts reporting to Capital IQ forecast Becton Dickinson & Co’s long-term earnings growth at 8.9%. Becton Dickinson & Co has medium long-term debt at 34% of capital. Becton Dickinson & Co is currently trading at a P/E of 13, which is inside the value corridor (defined by the five orange lines) of a maximum P/E of 18. If the earnings materialize as forecast, Becton Dickinson & Co’s True Worth™ valuation would be $131.88 at the end of 2017, which would be a 13.3% annual rate of return from the current price.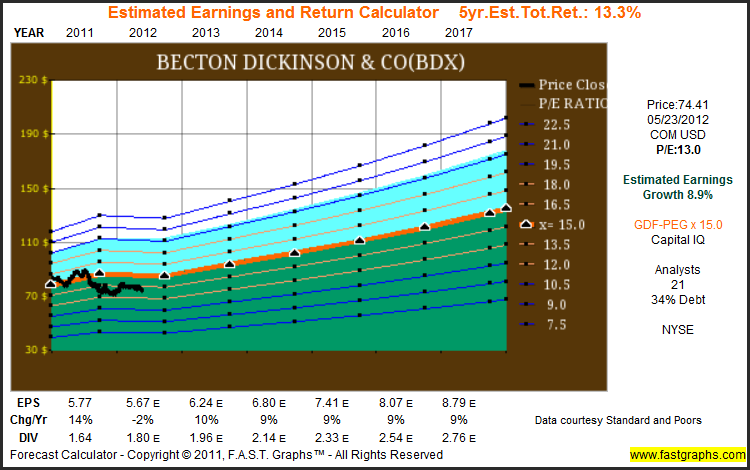
“The mission of STERIS Corporation is to provide a healthier today and safer tomorrow through knowledgeable people and innovative infection prevention, decontamination and health science technologies, products and services. The Company has approximately 5,000 dedicated employees around the world working together to supply a broad array of solutions by offering a combination of equipment, consumables and services to healthcare, pharmaceutical, industrial and government Customers.” 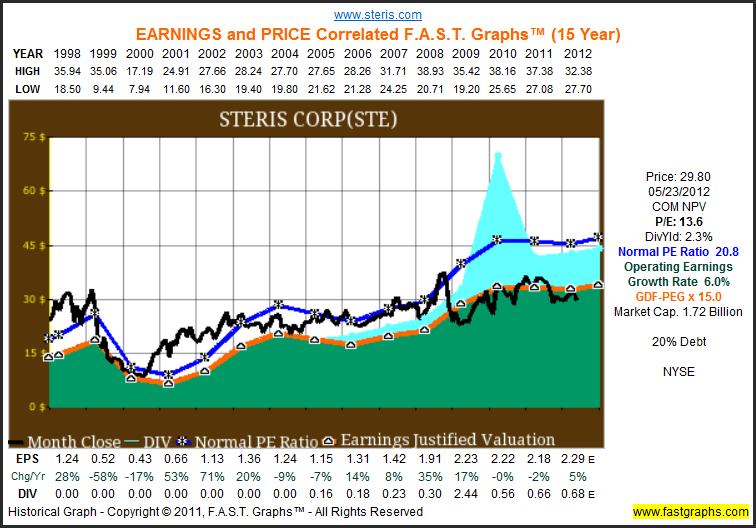
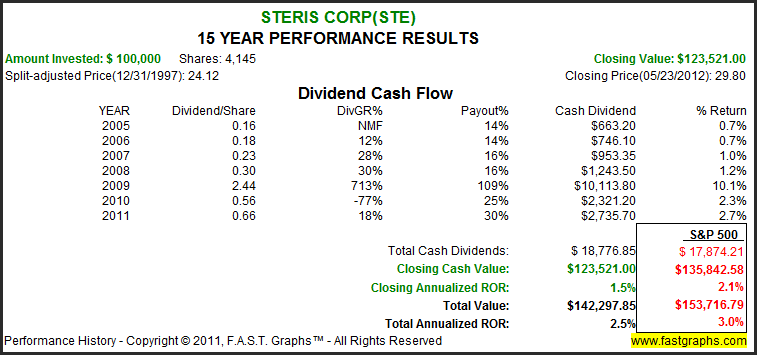
The consensus of 6 leading analysts reporting to Capital IQ forecast Steris Corp’s long-term earnings growth at 11.9%. Steris Corp has low long-term debt at 20% of capital. Steris Corp is currently trading at a P/E of 13.6, which is inside the value corridor (defined by the five orange lines) of a maximum P/E of 18. If the earnings materialize as forecast, Steris Corp’s True Worth™ valuation would be $60.53 at the end of 2017, which would be a 14.7% annual rate of return from the current price.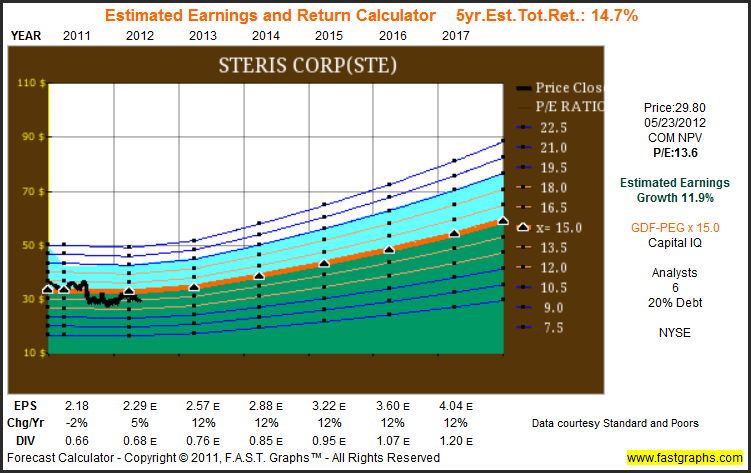
“Stryker is one of the world's leading medical technology companies and is dedicated to helping healthcare professionals perform their jobs more efficiently while enhancing patient care. The Company offers a diverse array of innovative medical technologies, including reconstructive, medical and surgical, and neurotechnology and spine products to help people lead more active and more satisfying lives.” 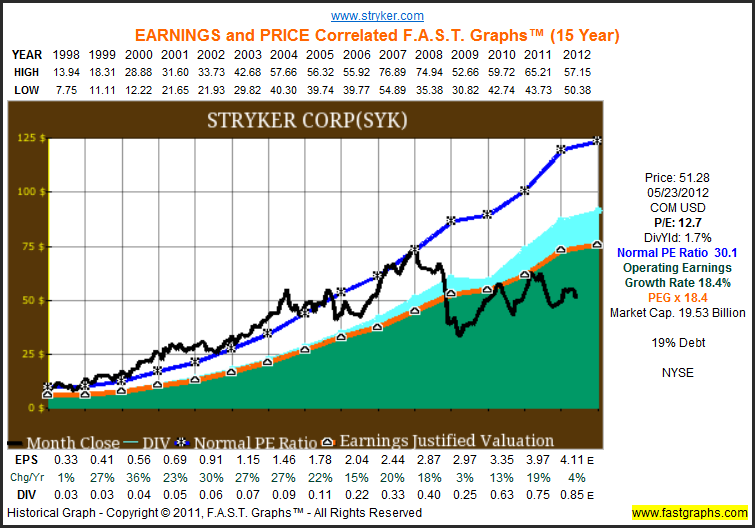
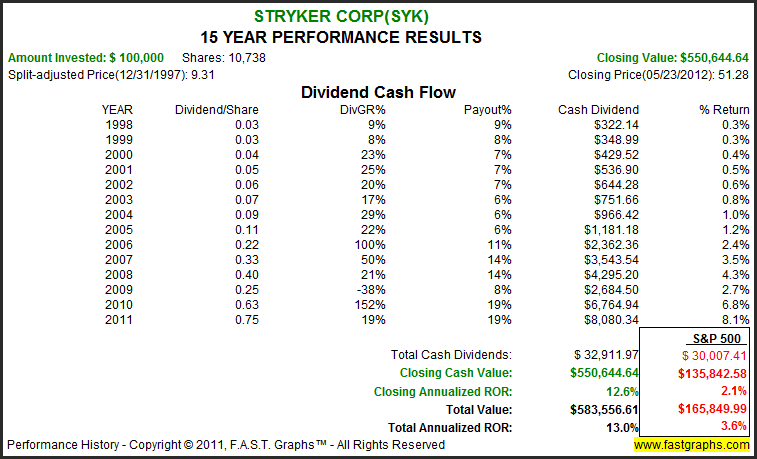
The consensus of 27 leading analysts reporting to Capital IQ forecast Stryker Corp’s long-term earnings growth at 11%. Stryker Corp has low long-term debt at 19% of capital. Stryker Corp is currently trading at a P/E of 12.7, which is inside the value corridor (defined by the five orange lines) of a maximum P/E of 18. If the earnings materialize as forecast, Stryker Corp’s True Worth™ valuation would be $102.70 at the end of 2017, which would be a 14.5% annual rate of return from the current price.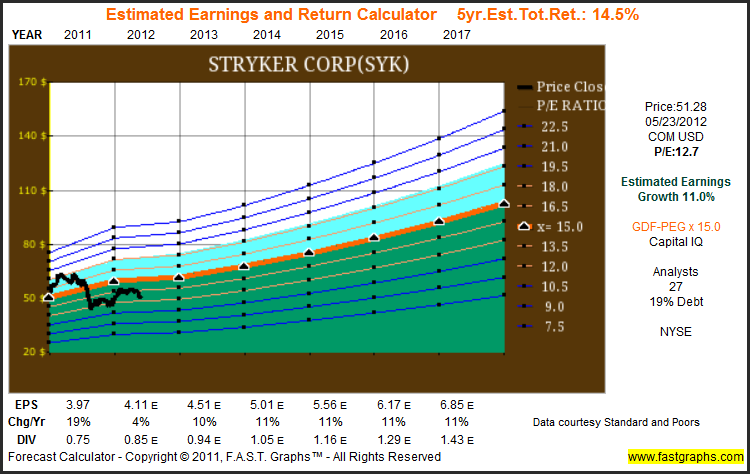
Summary and Conclusions
The market has created buying opportunities for those with a long-term perspective. Buying solid companies, at the right price, with above-average earnings growth estimates, as well as some dividend income can help an ailing portfolio. Remember, you make your money on the buy side. As always, we recommend you do your own thorough due diligence.
Disclosure: Long SYK and MDT at the time of writing.
Disclaimer: The opinions in this document are for informational and educational purposes only and should not be construed as a recommendation to buy or sell the stocks mentioned or to solicit transactions or clients. Past performance of the companies discussed may not continue and the companies may not achieve the earnings growth as predicted. The information in this document is believed to be accurate, but under no circumstances should a person act upon the information contained within. We do not recommend that anyone act upon any investment information without first consulting an investment advisor as to the suitability of such investments for his specific situation. A comprehensive due diligence effort is recommended.
- English (UK)
- English (India)
- English (Canada)
- English (Australia)
- English (South Africa)
- English (Philippines)
- English (Nigeria)
- Deutsch
- Español (España)
- Español (México)
- Français
- Italiano
- Nederlands
- Português (Portugal)
- Polski
- Português (Brasil)
- Русский
- Türkçe
- العربية
- Ελληνικά
- Svenska
- Suomi
- עברית
- 日本語
- 한국어
- 简体中文
- 繁體中文
- Bahasa Indonesia
- Bahasa Melayu
- ไทย
- Tiếng Việt
- हिंदी
Supply Your Portfolio With Healthy Growth From Medical Suppliers
Published 05/27/2012, 12:56 AM
Updated 07/09/2023, 06:32 AM
Supply Your Portfolio With Healthy Growth From Medical Suppliers
3rd party Ad. Not an offer or recommendation by Investing.com. See disclosure here or
remove ads
.
Latest comments
Install Our App
Risk Disclosure: Trading in financial instruments and/or cryptocurrencies involves high risks including the risk of losing some, or all, of your investment amount, and may not be suitable for all investors. Prices of cryptocurrencies are extremely volatile and may be affected by external factors such as financial, regulatory or political events. Trading on margin increases the financial risks.
Before deciding to trade in financial instrument or cryptocurrencies you should be fully informed of the risks and costs associated with trading the financial markets, carefully consider your investment objectives, level of experience, and risk appetite, and seek professional advice where needed.
Fusion Media would like to remind you that the data contained in this website is not necessarily real-time nor accurate. The data and prices on the website are not necessarily provided by any market or exchange, but may be provided by market makers, and so prices may not be accurate and may differ from the actual price at any given market, meaning prices are indicative and not appropriate for trading purposes. Fusion Media and any provider of the data contained in this website will not accept liability for any loss or damage as a result of your trading, or your reliance on the information contained within this website.
It is prohibited to use, store, reproduce, display, modify, transmit or distribute the data contained in this website without the explicit prior written permission of Fusion Media and/or the data provider. All intellectual property rights are reserved by the providers and/or the exchange providing the data contained in this website.
Fusion Media may be compensated by the advertisers that appear on the website, based on your interaction with the advertisements or advertisers.
© 2007-2024 - Fusion Media Limited. All Rights Reserved.
