
Superior Industries International, Inc. (NYSE:SUP) reported adjusted loss of 29 cents in third-quarter 2018, narrower than the Zacks Consensus Estimate of a loss of 35 cents. Including the impact of acquisition-related expenses, the company incurred net loss of $0.7 million or 37 cents a share.
Net sales were $348 million in the quarter, beating the Zacks Consensus Estimate of $347 million by a narrow margin. The reported figure was higher than $331.4 million recorded in the year-ago quarter.
During the third quarter, the company reported record wheel unit shipments of 4.7 million compared with 5.0 million a year ago. The decline was primarily due to reduced OEM production throughout Europe resulting from the impact of the Worldwide Harmonized Light Vehicle Test Procedure (WLTP) emission standards, lower aftermarket volumes, softer volumes from OEM customers in the United Kingdom.
Gross profit fell to $23.7 million from $23.9 million in the year-ago quarter.
Selling, general and administrative expenses contracted to $16 million in third-quarter 2018 from $18.1 million a year ago due to reduced acquisition and integration-related expenses.
Superior Industries International, Inc. Price, Consensus and EPS Surprise
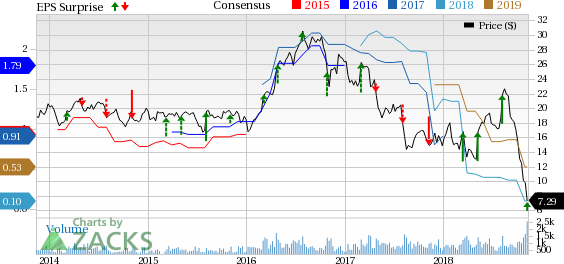
Superior Industries International, Inc. Price, Consensus and EPS Surprise | Superior Industries International, Inc. Quote
Financial Details
In third-quarter 2018, Superior Industries’ net cash provided by operating activities was $33.5 million compared with $27.2 million used in the year-ago period. Capital expenditure totaled $17.4 million compared with $26.8 million in the prior-year quarter.
Outlook
For 2018, Superior Industries has reaffirmed the outlook issued on Oct 24, 2018.
The company expects Unit shipments in the range of $20.85-$21.05 million and net sales of $1.48-$1.51 billion. Value-added sales are projected in the range of $790-$805 million. Adjusted EBITDA is expected in the band of $175-$180 million. Moreover, the effective tax rate is now anticipated to be at or below 0%. Capital expenditures are projected at around $85 million, while cash flow from operation is expected between $130 million and $145 million.
Zacks Rank & Key Picks
Superior Industries currently carries a Zacks Rank #4 (Sell). A few better-ranked stocks in the auto space are O’Reilly Automotive, Inc. (NASDAQ:ORLY) , General Motors Company (NYSE:GM) and Tesla, Inc. (NASDAQ:TSLA) . O’Reilly and General Motors currently carry a Zacks Rank #2 (Buy), while Tesla sports a Zacks Rank #1 (Strong Buy). You can see the complete list of today’s Zacks #1 Rank stocks here.
O’Reilly has an expected long-term growth rate of 15.7%. Over the past six months, shares of the company have gained 30%.
General Motors has an expected long-term growth rate of 8.5%. Shares of the company have increased 11.1% in the past month.
Tesla has an expected long-term growth rate of 10%. Shares of the company have rallied 20% in the past six months.
More Stock News: This Is Bigger than the iPhone!
It could become the mother of all technological revolutions. Apple (NASDAQ:AAPL) sold a mere 1 billion iPhones in 10 years but a new breakthrough is expected to generate more than 27 billion devices in just 3 years, creating a $1.7 trillion market.
Zacks has just released a Special Report that spotlights this fast-emerging phenomenon and 6 tickers for taking advantage of it. If you don't buy now, you may kick yourself in 2020.
Click here for the 6 trades >>
General Motors Company (GM): Free Stock Analysis Report
Tesla, Inc. (TSLA): Free Stock Analysis Report
O'Reilly Automotive, Inc. (ORLY): Free Stock Analysis Report
Superior Industries International, Inc. (SUP): Free Stock Analysis Report
Original post