The leadership of US equities in the horse race among the major asset classes is a sight to behold. By almost any yardstick, the stock market for the world’s biggest economy has been and remains a dominant force of financial nature among global markets.
The breadth and duration of this US-based juggernaut inspires warnings in some circles that the trend has become overextended and therefore ripe for a correction. The opposing view is that positive momentum begets positive momentum. Time will tell which side is right. Meantime, US supremacy rolls on.
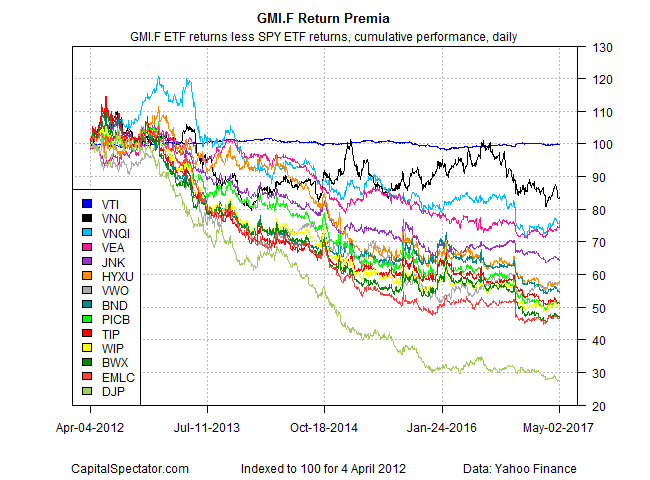
To fully appreciate the trend, a few charts are in order. Let’s start by comparing how US equities (S&P 500) compare with the major asset classes, based on a set of ETF proxies, for the past five years. The first chart below shows the cumulative performance of the return spread for the ETFs relative to the SPDR S&P 500 (MX:SPY (NYSE:SPY)), with a start date of Apr. 4, 2012. When a line is rising, the ETF is outperforming SPY, and vice versa. But as you can see, SPY has had no challengers to its leadership in recent years.

The flat, dark-blue line that hugs the 100 mark is Vanguard Total Stock Market (NYSE:VTI), a somewhat broader measure of US equities relative to SPY. Not surprisingly, VTI has generally held steady against its more popular counterpart. Otherwise, the rout is complete in terms of SPY’s performance supremacy in recent history.
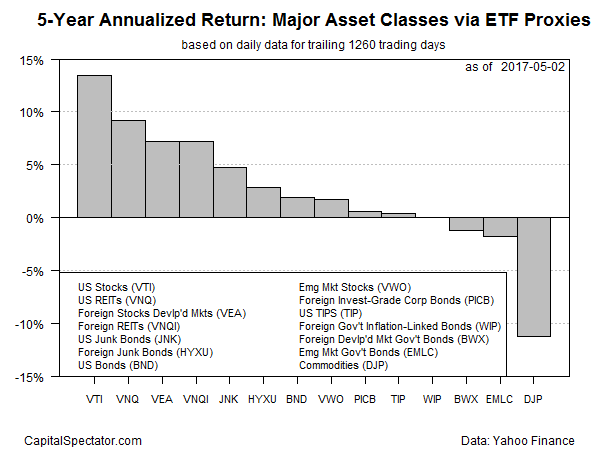
Why look at the past five years? That’s a trailing window that’s been cited as a rough estimate of valuation (for details, see this post). By that measure, US equities appear pricey relative to the rest of the field. VTI is sitting on a strong 13.5% annualized total return for the five years through May 2 – roughly 50% more than the second-best performing asset class. Compared with the bottom performer for the trailing five-year window (commodities), well, let’s just say that two markets are separated by a galaxy or two these days.

What are the implications of the charts above for asset allocation? Toning down US equity allocations comes to mind. That’s not based on a forecast; rather, it’s simply an observation that taking money off the table in a slice of global markets that’s delivered exceptionally strong results has a certain appeal from a probability perspective, based on what we know of the long sweep of market history.
Consider that the long-term performance of the US stock market is roughly 10% a year, according to David Blanchett, the head of retirement research for Morningstar Investment Management. By that standard, US equities have delivered a third more than their long run return over the last five years.
Meanwhile, history reminds us that unusually strong outperformance (or underperformance) for any asset class is a temporary affair, even if recency bias suggests otherwise. Defining a relevant measure of “temporary” in advance for optimizing performance is guesswork, of course, and so it’s debatable if the powerful bull market for US equities is vulnerable, or not, to mean reversion in the near term. Nonetheless, trees don’t grow to the sky.
At some point, the extraordinary relative outperformance of the US stock market will fade. That doesn’t mean that a crash or bear market is near. But whenever an investment – in any asset class — delivers substantially more return than expected over a comparatively short time frame, the case for preserving gains (as opposed to chasing return) resonates.
The good news is that there’s an easy way to operationalize this concept: systematic rebalancing. The details of design and implementation will vary from investor to investor, but the basic theme of selling winners and buying losers, if only on the margins, is a core element in prudent risk management.
The reality is that few investors are able to routinely exploit rebalancing through time, largely due to behavioral issues. Therein lies the reason for why only a minority of investors (perhaps a tiny minority) earn outsized returns, which are paid for via subpar (or negative) results for everyone else.
How can that be? Recent history offers yet another teachable moment. Stellar returns are widely expected to persist, in direct opposition to the lessons of history. Translated: financial intelligence is cyclical, not cumulative. Unless everything really is different this time.
