Get 40% Off
These stocks are up over 10% post earnings. Did you spot the buying opportunity? Our AI did.Read how

Strong Price Action For Global Equities

Published 08/07/2016, 02:41 AM
Updated 07/09/2023, 06:31 AM

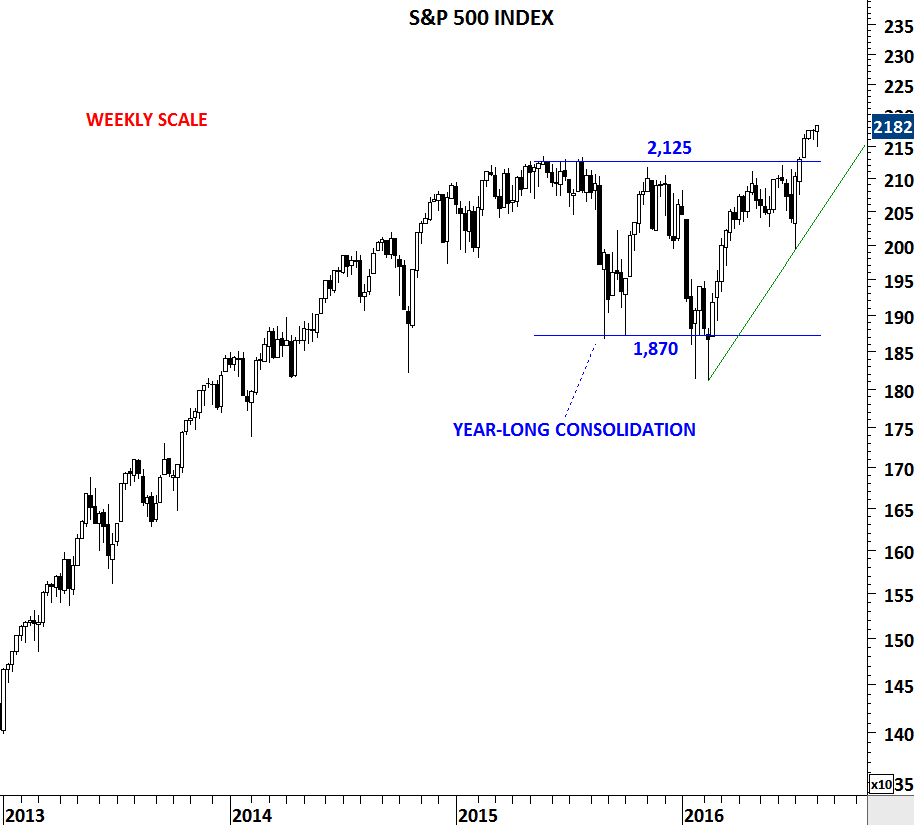
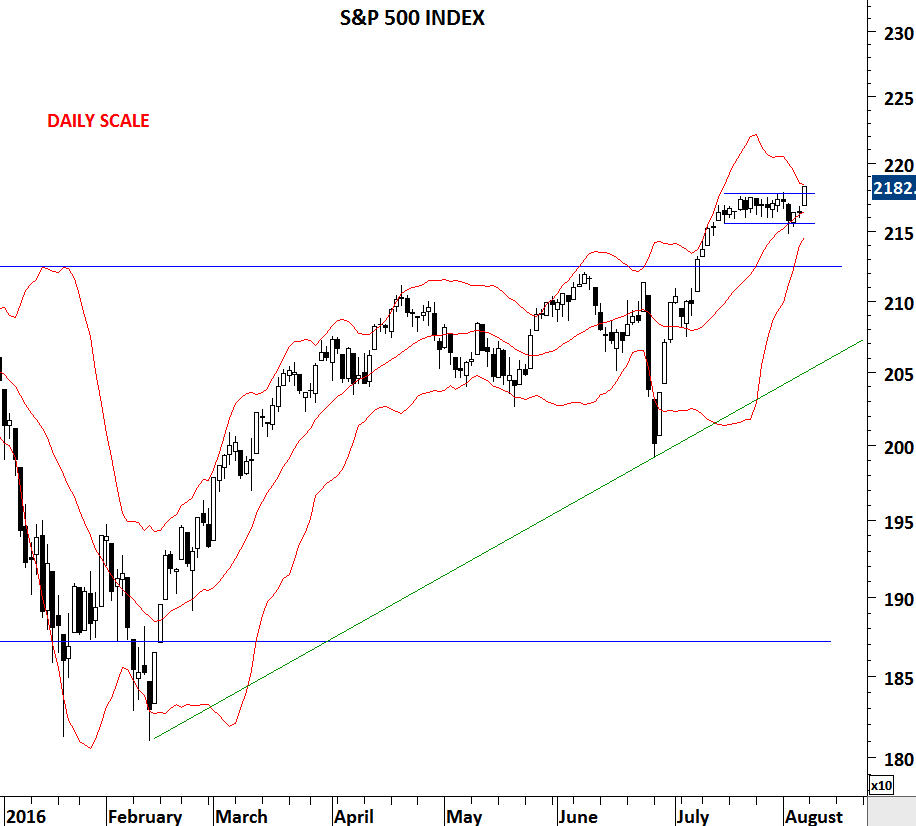
Global equities get a boost from both S&P 500 and Dow Jones Industrial averages breaking out to all-time high levels. In mid-July, S&P 500 index cleared the strong resistance at 2,125 and recorded an all-time high. This was followed by two weeks of consolidation in a very tight range. With Friday's strong close it is likely that U.S. equities and global equities in general will resume their up trends in the following months.

S&P 500 Weekly Chart

On the weekly chart, the resistance at 2,125 levels will now become support. Upward break from the year-long consolidation will gain momentum and resume higher as long as the index remains above 2,125 levels.

S&P 500 Daily Chart

On the daily scale, low volatility registered by contracting Bollinger bands® suggests a strong directional move is likely to follow. A breach of the upper band in the following trading sessions will confirm this.

MSCI All Countries Monthly Chart

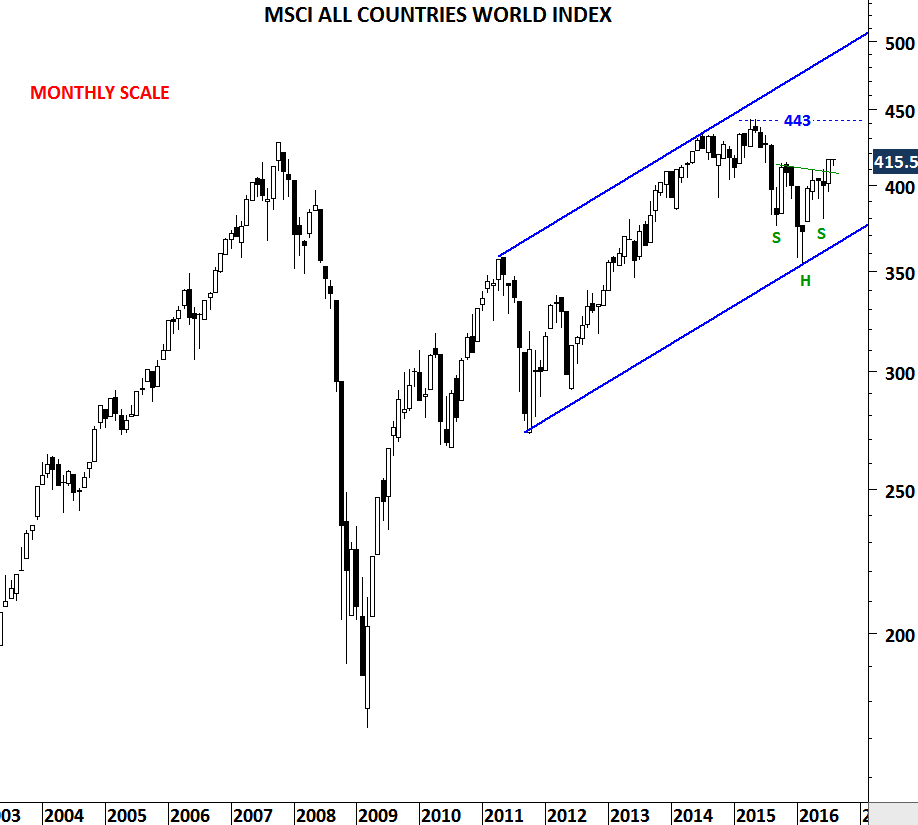
MSCI all-country World Equity Index that captures large and mid-cap representation across 23 Developed Markets and 23 Emerging Markets countries, formed a clear upward trend channel. Long-term uptrend resumes between the boundaries of this channel with the historical high standing at 443 levels.

MSCI All Countries World Index Weekly Chart

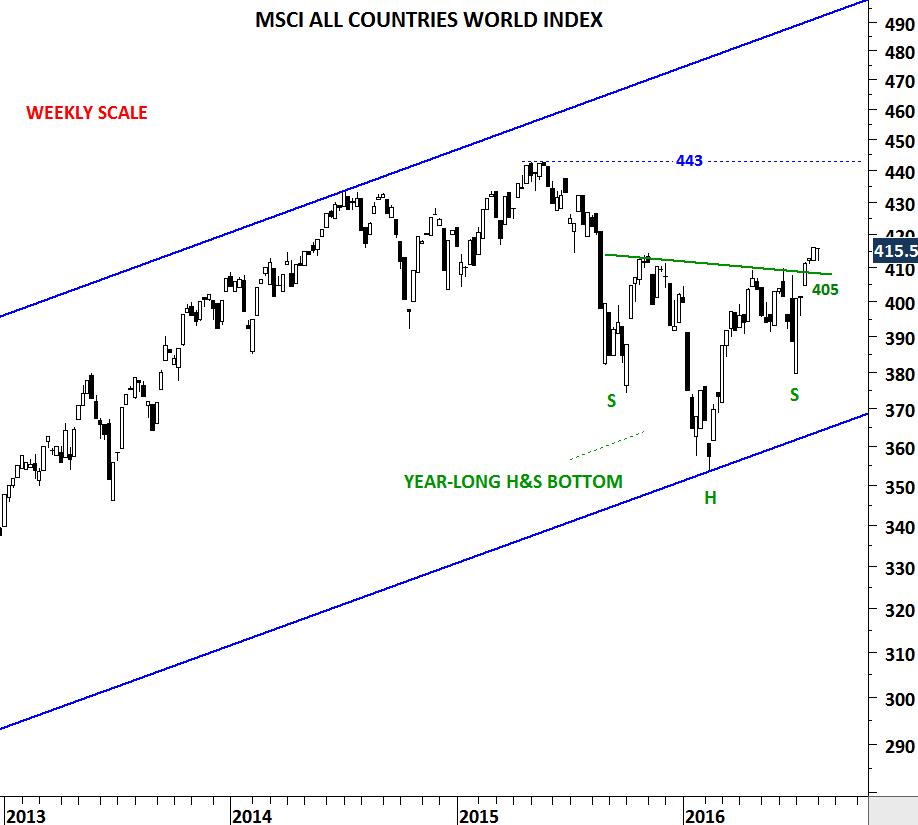
The weekly chart of the MSCI All Countries World index is more constructive and suggests a year-long H&S bottom is now completed. Price target for the H&S bottom stands at 460 levels. 2015 high level is at 443 levels. Breakout from this bullish chart pattern can target 443-460 area in the following months. Failure to remain above 405 levels will negate this bullish outlook.

3rd party Ad. Not an offer or recommendation by Investing.com. See disclosure here or remove ads .

Latest comments

Risk Disclosure: Trading in financial instruments and/or cryptocurrencies involves high risks including the risk of losing some, or all, of your investment amount, and may not be suitable for all investors. Prices of cryptocurrencies are extremely volatile and may be affected by external factors such as financial, regulatory or political events. Trading on margin increases the financial risks.
Before deciding to trade in financial instrument or cryptocurrencies you should be fully informed of the risks and costs associated with trading the financial markets, carefully consider your investment objectives, level of experience, and risk appetite, and seek professional advice where needed.
Fusion Media would like to remind you that the data contained in this website is not necessarily real-time nor accurate. The data and prices on the website are not necessarily provided by any market or exchange, but may be provided by market makers, and so prices may not be accurate and may differ from the actual price at any given market, meaning prices are indicative and not appropriate for trading purposes. Fusion Media and any provider of the data contained in this website will not accept liability for any loss or damage as a result of your trading, or your reliance on the information contained within this website.
It is prohibited to use, store, reproduce, display, modify, transmit or distribute the data contained in this website without the explicit prior written permission of Fusion Media and/or the data provider. All intellectual property rights are reserved by the providers and/or the exchange providing the data contained in this website.
Fusion Media may be compensated by the advertisers that appear on the website, based on your interaction with the advertisements or advertisers.
© 2007-2024 - Fusion Media Limited. All Rights Reserved.