
The Aussie weakened rather sharply today without much in the way of catalysts, a move that has me sitting up and taking notice. But we'll need to sell a generalized reduction in risk appetite to see a more durable sell-off.
Japan saw a bad miss on Q2 GDP. The economy managed a “positive” GDP print, but only because the GDP deflator was out at an ugly -1.1% YoY, so in nominal terms, growth was actually slightly negative in quarter-on-quarter terms. This underlines the frailty of the Japanese economy and recent rises in commodity prices aren’t particularly helpful for the economy or the yen’s cause. Still, the direction of the JPY in the near term is likely to be determined by the direction of interest rates as any look at a bond yield chart versus JPY crosses shows. On that note, the inability of the USDJPY to break a bit higher is remarkable in light of the recent weakness in bonds and is likely a symptom of the market unwilling to bet on the USD when risk appetite and complacency are so strong nearly across the board. Further downside pressure on the JPY could come from the last week’s passage of the sales tax measures and political uncertainty that this opens up as the lower house of parliament may be dissolved soon (as part of the deal in ensuring its passage so that the LDP has a chance at recapturing the lower house).
Strong AUD – when is enough enough?
Enough is enough. The Aussie has reached yet another peak against the rest of the G-10 currencies in recent days. It is extremely overvalued given the global backdrop – particularly the recent weak data out of China. Of course, the Aussie rally will only fade once we see the current very complacent environment also changing character, but a couple of signs that the Aussie’s star may at least consolidate include today’s very sharp EURAUD rally and extremely long speculative positioning (at least as measured by the weekly US futures report.)
Chart: EUR/AUD
Interesting development in the EURAUD chart today as the pair rallied sharply to start the week. It’s always interesting when this kind of move unfolds despite a lack of catalysts.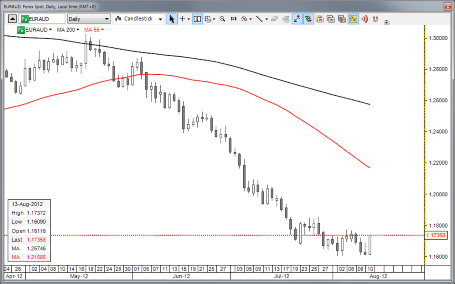 EUR/USD" title="EUR/USD" width="455" height="284">
Looking ahead
Interesting move in the Euro to the strong side today as EUR/USD found support near the mid-point of the current range, though we need to see the recent highs taken out for further upside momentum . My near term outlook will allow for EUR/USD to drift to 1.2500 to 1.2600, but the longer term view remains lower. The more dramatic moves in this market are likely to come in the Aussie and other commodity currencies as they have moved the most in the latest bout of strong risk appetite.
The salient feature of this market, as I have noted several times recently, is the tremendous degree of complacency as we head into key event risks in coming weeks and months, particularly the German Constitutional court ruling in September and then the US election on November 2 (with the status of the US economy hanging in the balance in the meantime and Jackson Hole coming up at the end of this month). There is just too little worry priced into this market.
For those looking for magic bullets from the Fed, consider the Bloomberg article discussing the wide range of views from the Fed and this strange never-ending search for transparency from the Fed: http://www.bloomberg.com/news/2012-08-13/yellen-must-show-how-12-fed-opinions-become-one-policy.html. We’ve already priced in a good deal of the next QE, whatever version it takes, and much of that is thanks to the Fed’s “transparency”, meaning that once the market sees the whites of the eyes of the thing it has been so ardently expecting, there may be no additional effect to price in and you have the classic – buy the rumour, sell the fact response.
Tomorrow is an important day for US economic data, as we have the US Retail Sales on tap. US consumers have been on strike for the three previous months, 3 months that all saw negative month-on-month developments in retail sales – even for the ex Autos and Gas number in spite of a steep drop in gasoline prices from an April peak. If we get a fourth negative number, it will reinvigorate the recession discussion.
Later in the week, we also have the first two major US manufacturing surveys, the Empire and Philly Fed surveys on Wednesday and Thursday, respectively.
Look out for the UK RICS House Price survey this evening – the UK housing market is showing marked signs of weakening and I would expect this to pick up speed this fall. GBPUSD may look like it wants to break higher and may do so in the shortest term, but I still have a jaundiced eye on any GBP strength of any duration.
Economic Data Highlights
- Japan Q2 GDP out at +0.1% QoQ and +1.4% YoY vs. +0.6%/+2.3%
- Norway Jun. Retail Sales out at -1.1% MoM and +7.4% YoY vs. -0.5%/+4.1% expected, respectively and vs. +4.2% YoY in May
- UK Jul. RICS House Price Balance (2301)
- Japan BoJ releases meeting minutes (2350)
- Australia Jul. NAB Business Conditions/Confidence (0130)