A confluence of factors led to this week’s sell-off in markets. In the lead up to this week’s market top we saw all the classic signs: Weakening participation, highly overbought readings, vast technical extensions, historic valuations accompanied by extreme complacency and bear capitulations.
And make no mistake: This sell-off was intense. NDX dropped 10% within 2 days off of all-time highs, one of the fastest and steepest drops from all-time highs in history if not the most in history. High flying tech stocks such as Apple (NASDAQ:AAPL) and Tesla (NASDAQ:TSLA) dropped 20% and 26% in 2 days as well.
Was this a mere flesh wound in what was an unstoppable rally or signs of the end is here or at least the beginning of the end?
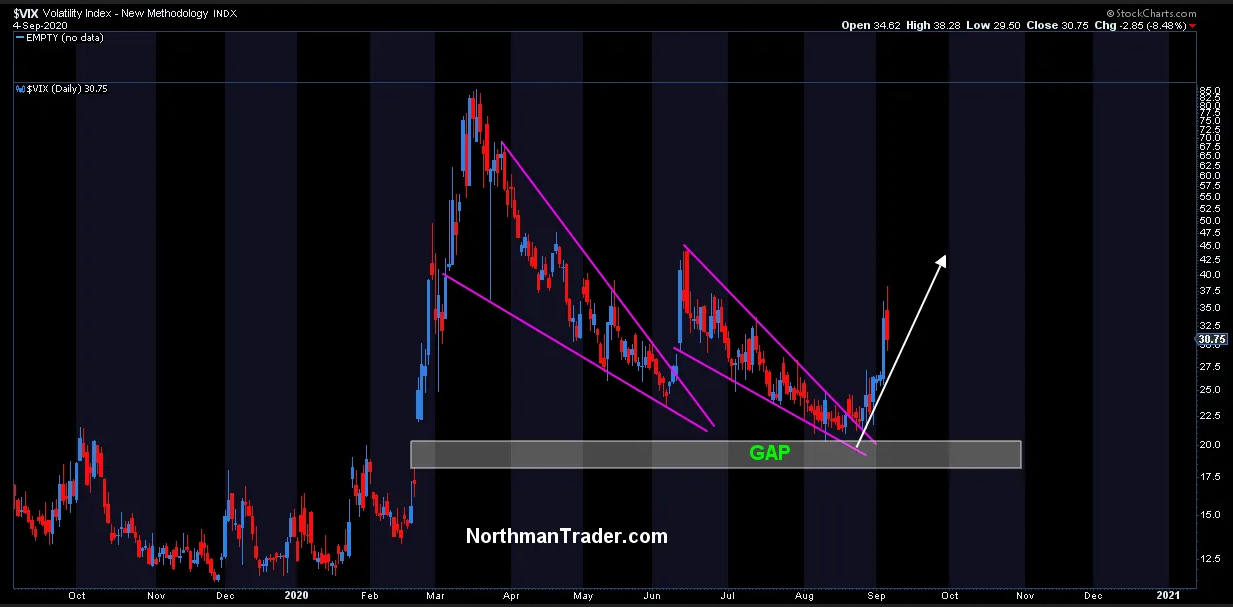
The VIX. In August I published VIX 46 when VIX was trading at 22 calling for a breakout to come with a target for 46. While the target has not been reached as of this writing we did get a major breakout and the VIX hit 38 on Friday an over 70% move from the original post:
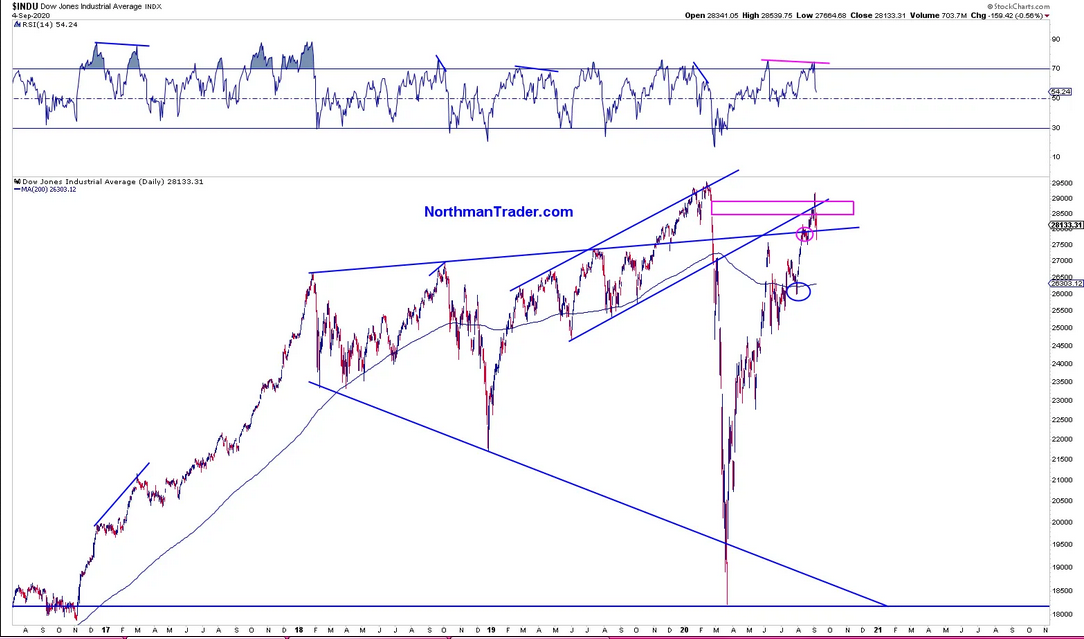
Also in August I mentioned the DJIA having potential from its February gap and this gap was filled this week and it produced a rejection from here:
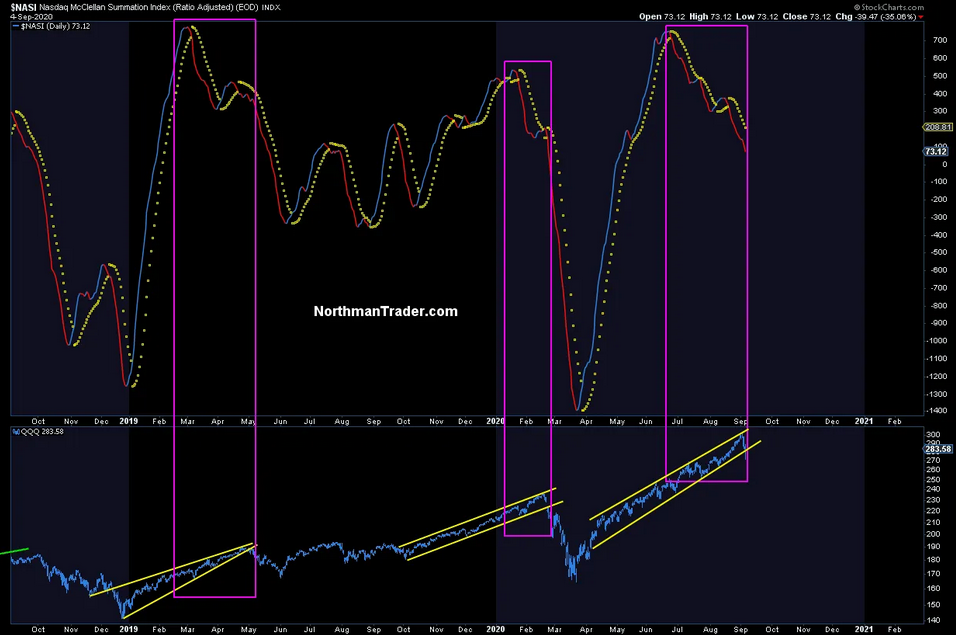
Also in August, I kept talking about the weakening signals underneath and a warning sign on tech specifically the NASI pointing to a coming correction in tech:
And I kept talking about the lack of confirmation in the value line geometric index XVG with its message:
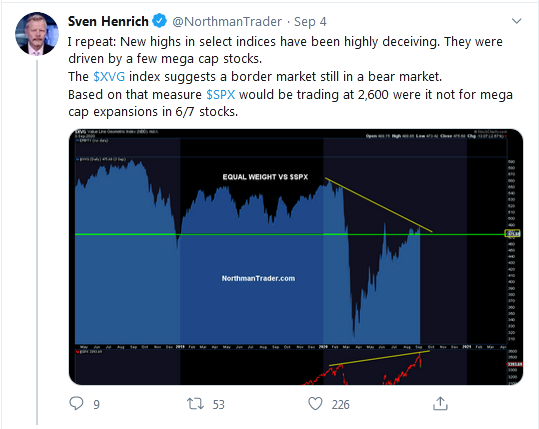
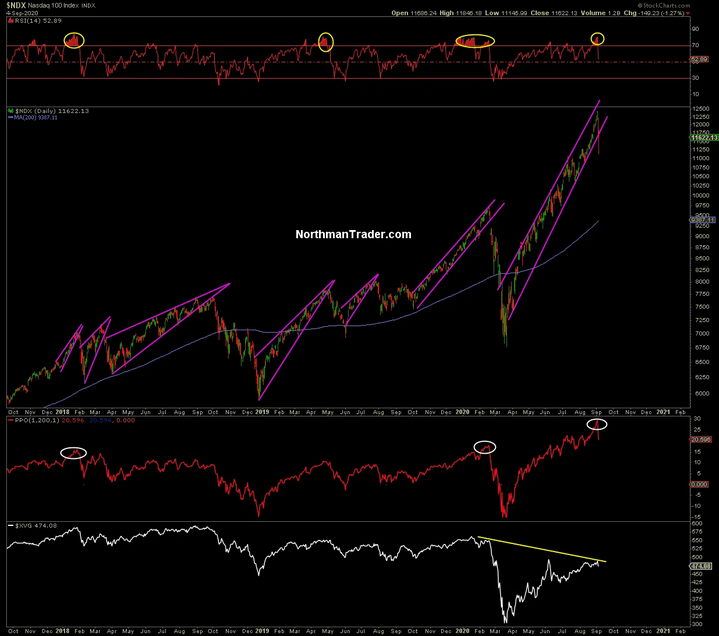
While indices kept driving to new highs in ever more extended patterns, similar to rallies we’ve seen before with this being the most extended since the year 2000. SPX traded the highest above its 200MA and NDX reached prices 33% above its 200MA:
All this as put/call ratios hit historic lows:
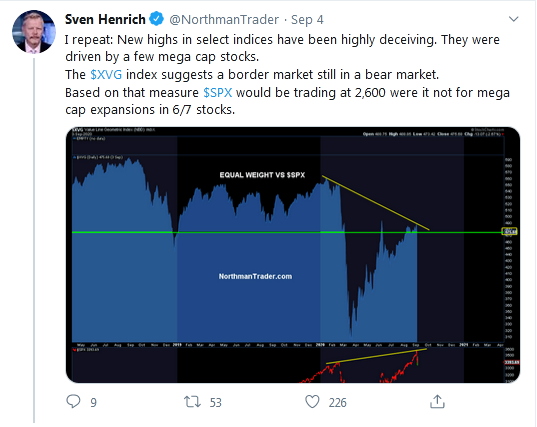
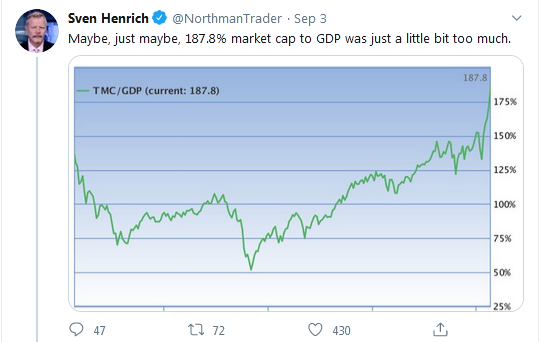
While markets levitated to the highest disconnect from the underlying size of the economy ever:
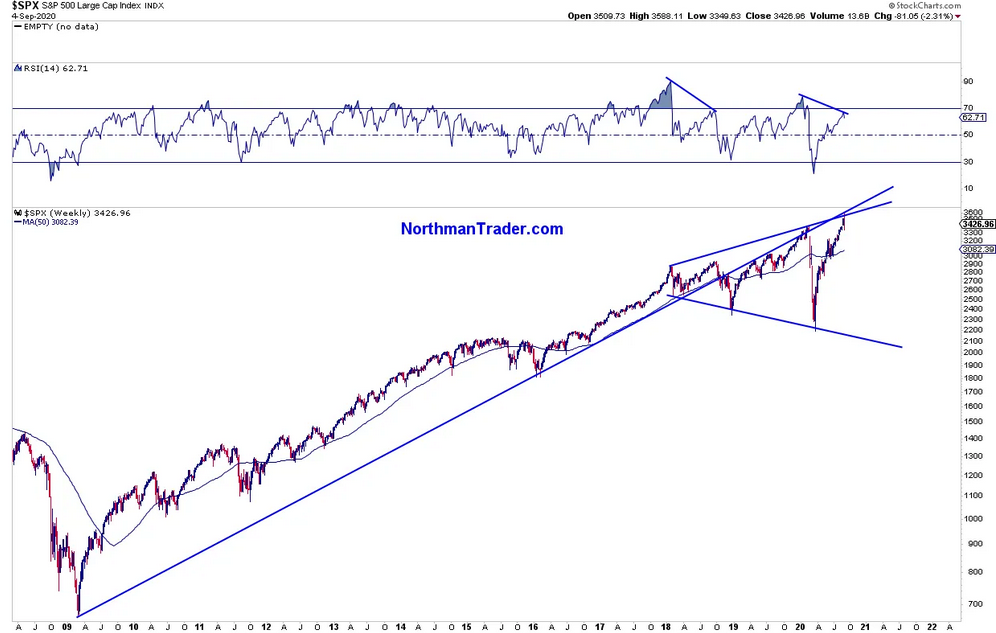
And finally as outlined in Bear Capitulation and Panic Buying SPX was reaching historic resistance as evidence by 2 key trend lines, both were hit this week and SPX rejected from there:
In the context of history is this a coincidence that this all happened to come together at the beginning of September?
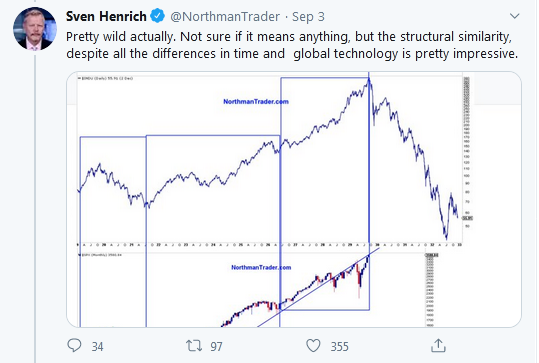
After all, following the market top in March of 2000 the subsequent counter-rally peaked on September 1 and the top in 1929 ended on September 3rd, as did now this rally. This rally topping on September 2nd and in pre-market on September 3rd could all be a coincidence of course, but only time will tell.
The similarity in structure though between the historic run leading to the top in 1929 and the last 13 years is striking:
