Get 40% Off
🚨 Volatile Markets? Find Hidden Gems for Serious Outperformance
Find Stocks Now

Stocks Test Critical Resistance Levels And Fail, Again

Published 06/24/2020, 03:53 AM
Updated 09/20/2023, 06:34 AM

S&P 500

Stocks had an okay day yesterday, rising by about 50 basis points on the S&P 500. It could have been much better, but the index can’t get out of its way. There is something that is happening in the E-minis and the SPX cash that there is a huge level of resistance the market just can’t get through. I think it is a negative sign for the index at this point.
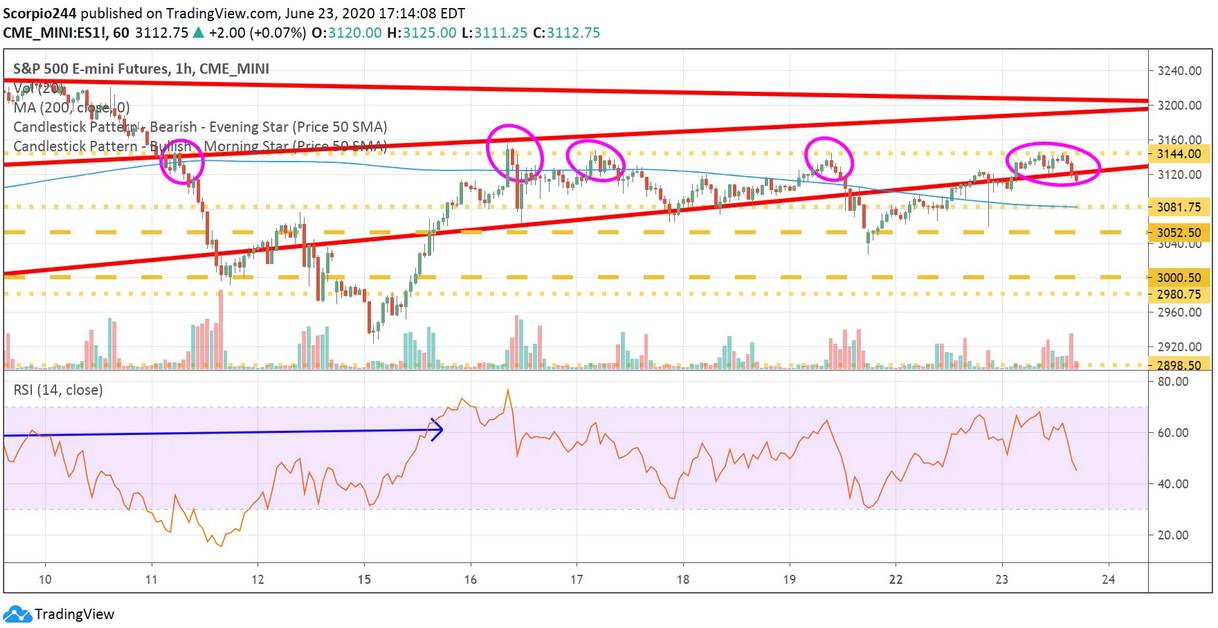
S&P 500 Emini Futures Hourly Chart

Yesterday marked the fifth time the futures have failed at 3,145. Something similar did happen in July 2019, and it led to a sizeable sell-off of about 8% at the time. 8% doesn’t seem so scary or severe, given what we have gone through. It also resulted in August being an extremely choppy month.
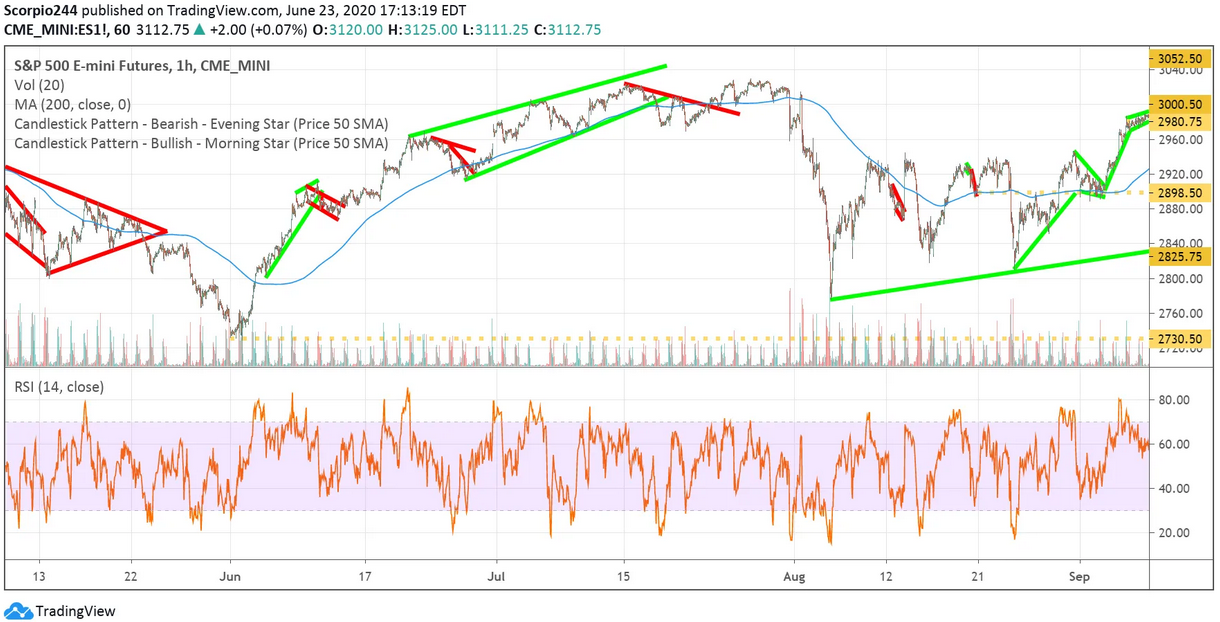
S&P 500 Emini Futures Chart

I think the S&P 500 is setting up for a decline to around 2,960.

NASDAQ

The NASDAQ is just not set up to go higher either at this point. It is now the sixth time the QQQ reached the upper level of its trading range. Since April, every time the ETF has hit that upper range, it has resulted in a decent pullback. Additionally, the ETF’s RSI hit overbought levels today around 70. It seems like there is a good chance here for the QQQs to fall back to $240.
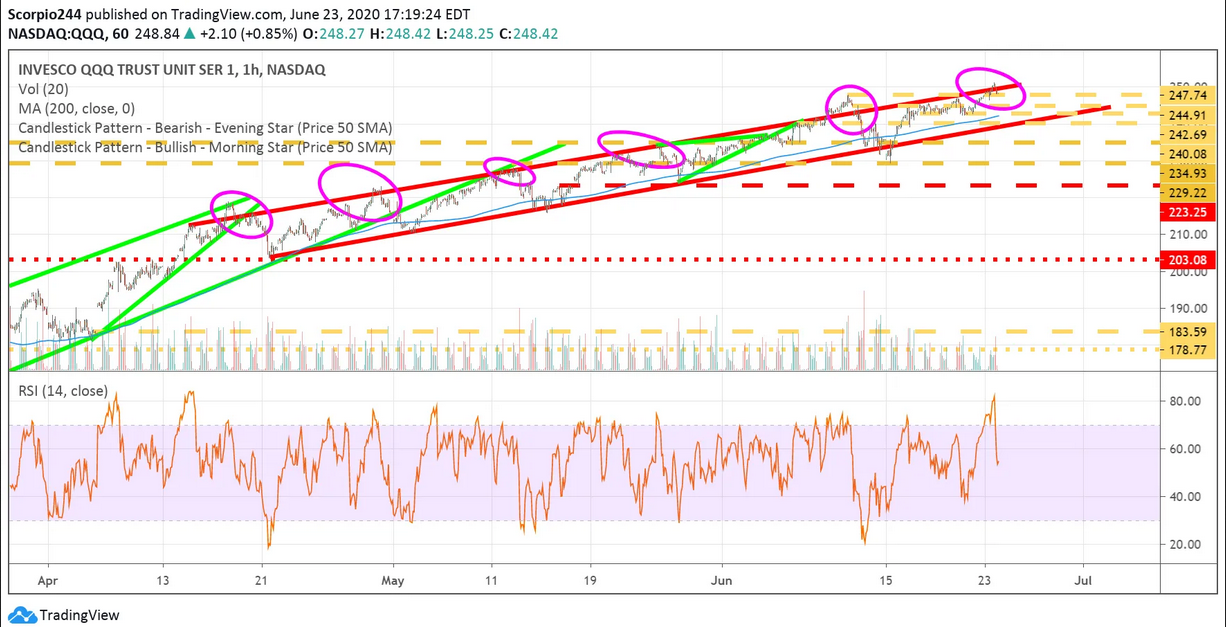
QQQ 1 Hour Chart

Technology

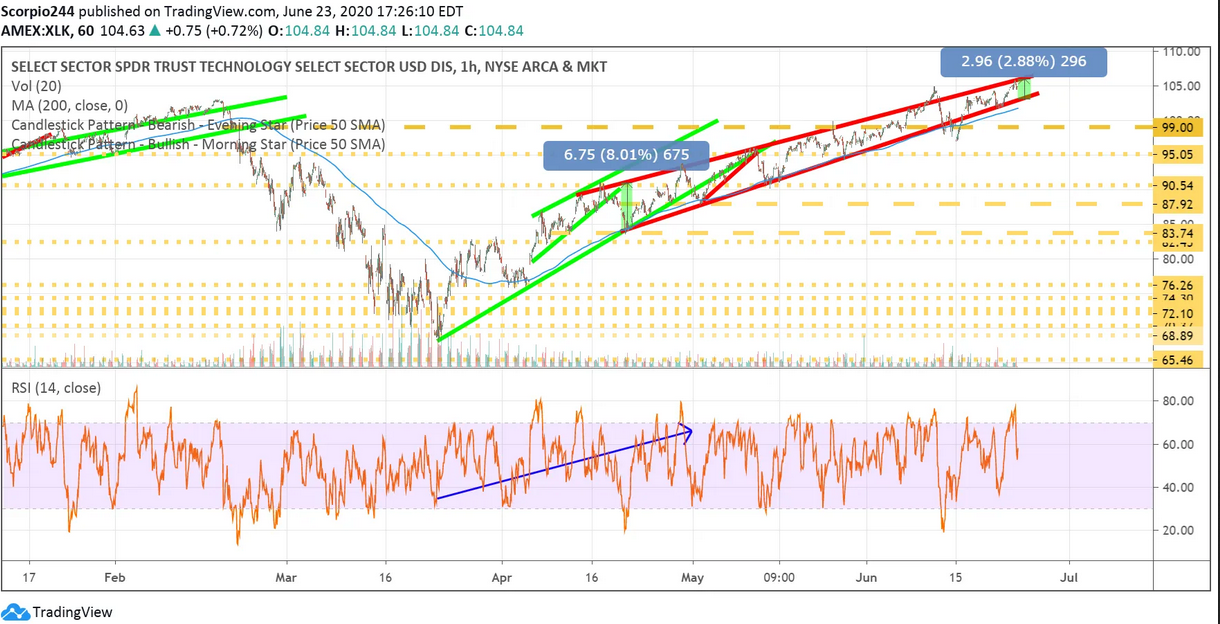
The Technology Sector ETF (NYSE:XLK) also continues to move higher, but interestingly, the trading channel is not a channel at all. It hasn’t become apparent until recently to me, but it is one large rising wedge pattern. You can see when the channel started in April it was about 8% wide, now it is just 3% wide.
3rd party Ad. Not an offer or recommendation by Investing.com. See disclosure here or remove ads .

XLK Chart

Alibaba

Alibaba (NYSE:BABA) has had a powerful run and is pushing up near resistance at $231. The RSI is still tracking higher, and I think the stock continues to push up, despite broader market weakness. $247.50 is an achievable level.
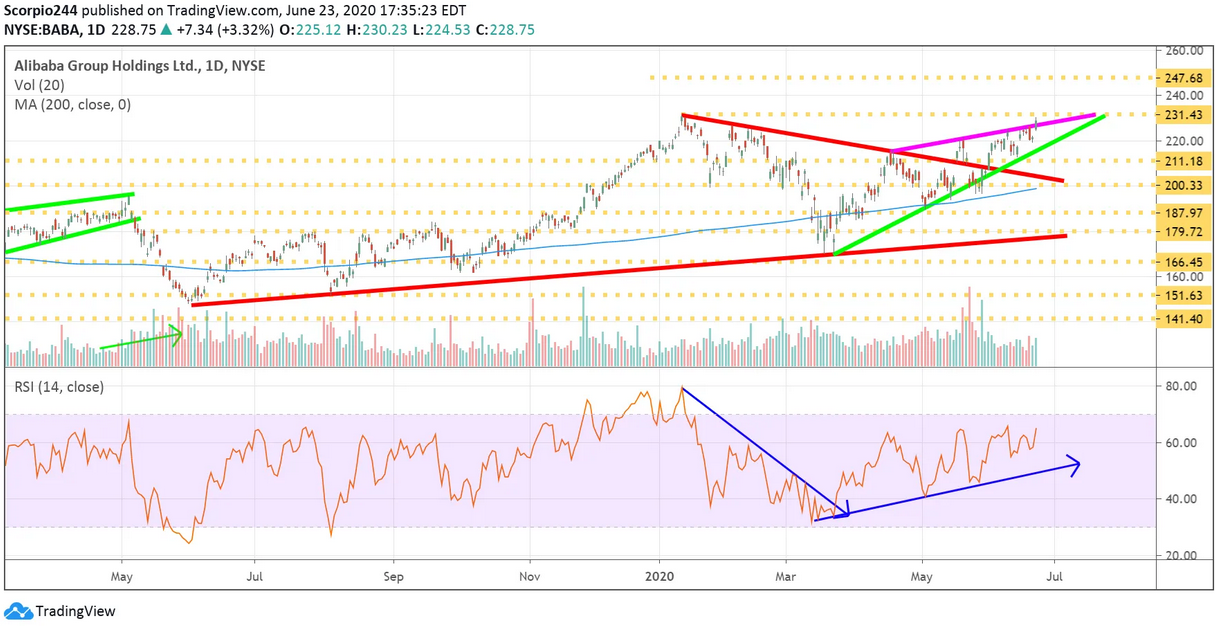
Alibaba Ltd Daily Chart

Apple

Apple (NASDAQ:AAPL) continues to melt higher, and nobody could be happier than I am. But even I know when stocks I own need to cool off, Apple needs to cool off. The RSI is over 70 again, and the stock hit that resistance level I point out a few weeks ago at $372. So this seems like the ideal place for a pullback to $325.
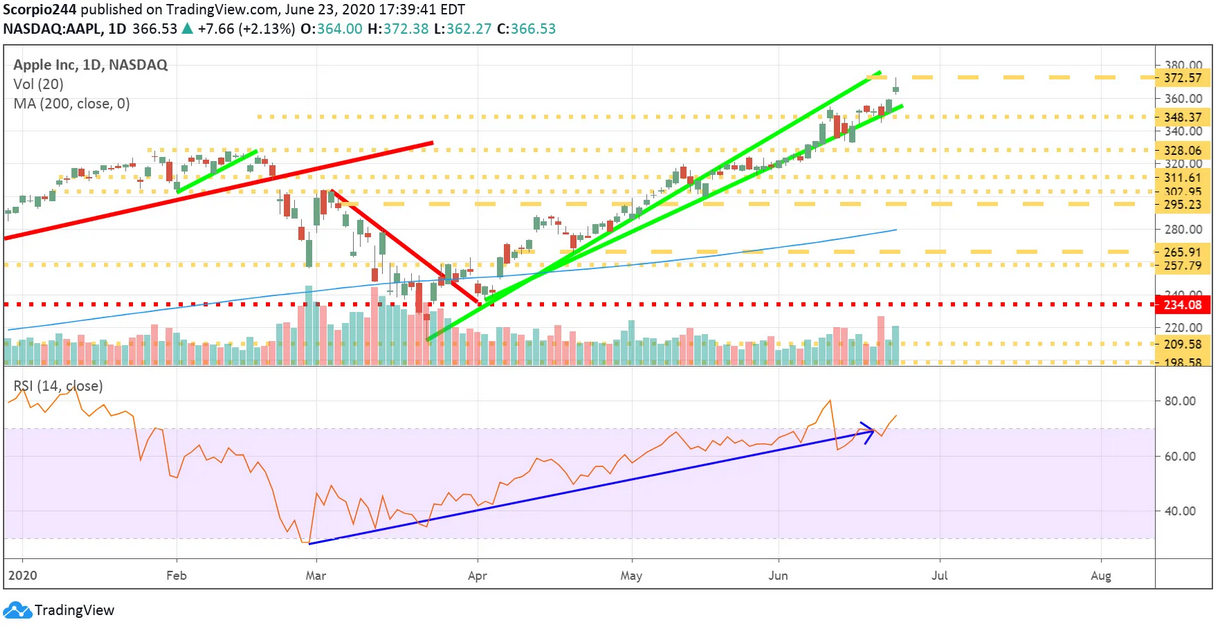
Apple Inc Daily Chart

Intel

Intel (NASDAQ:INTC) doesn’t look particularly strong here, with the potential to drop to around $55.90.
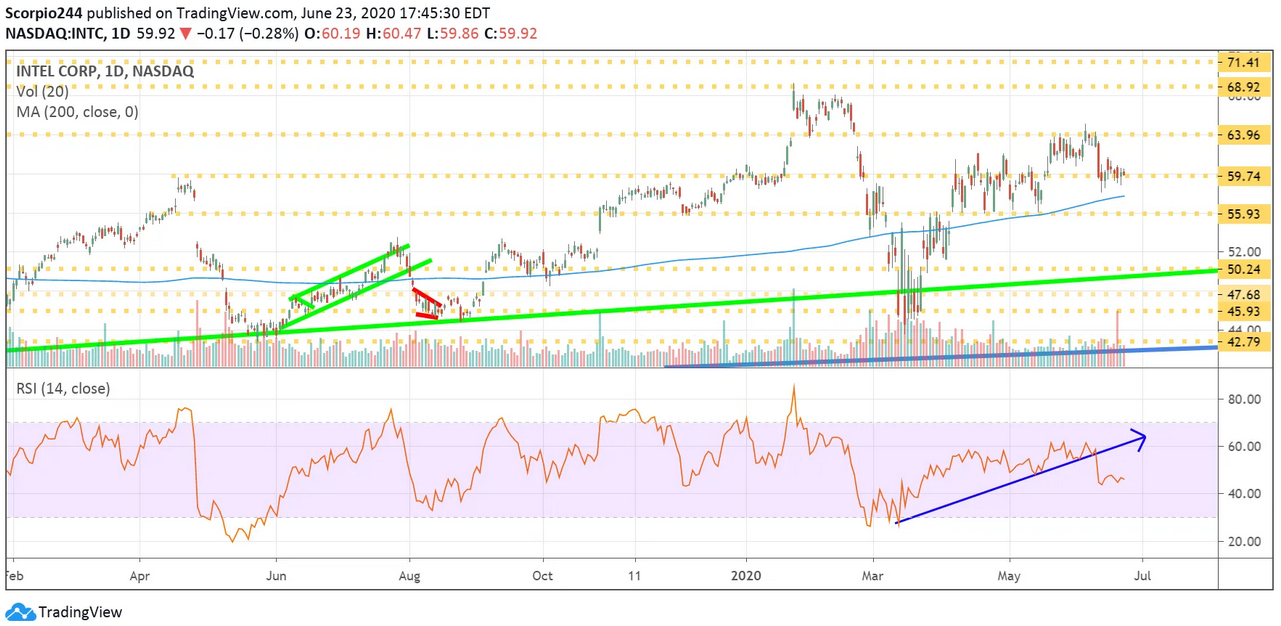
Intel Corp Daily Chart

Micron

Micron (NASDAQ:MU) is also sitting on support at $49.80, and the RSI is moving lower. I think the odds of a drop to $45.50 are rising.
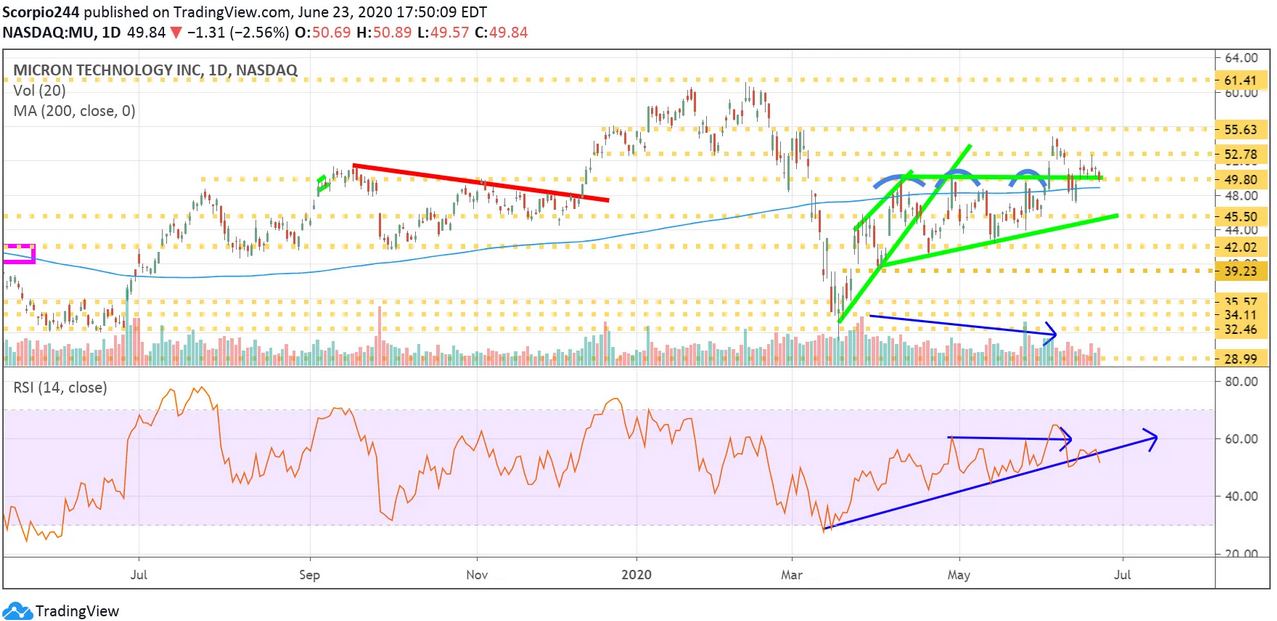
Micron Inc Daily Chart

ACADIA Pharmaceuticals

ACADIA Pharmaceuticals (NASDAQ:ACAD) is so close to making a new all-time high. Yesterday it got some positive commentary out of Jefferies about the companies upcoming readout for its depression trial. I think there will be plenty more positive commentary to come. I happen to believe they will have a positive readout for depression as well. A break out could push shares on to $75.
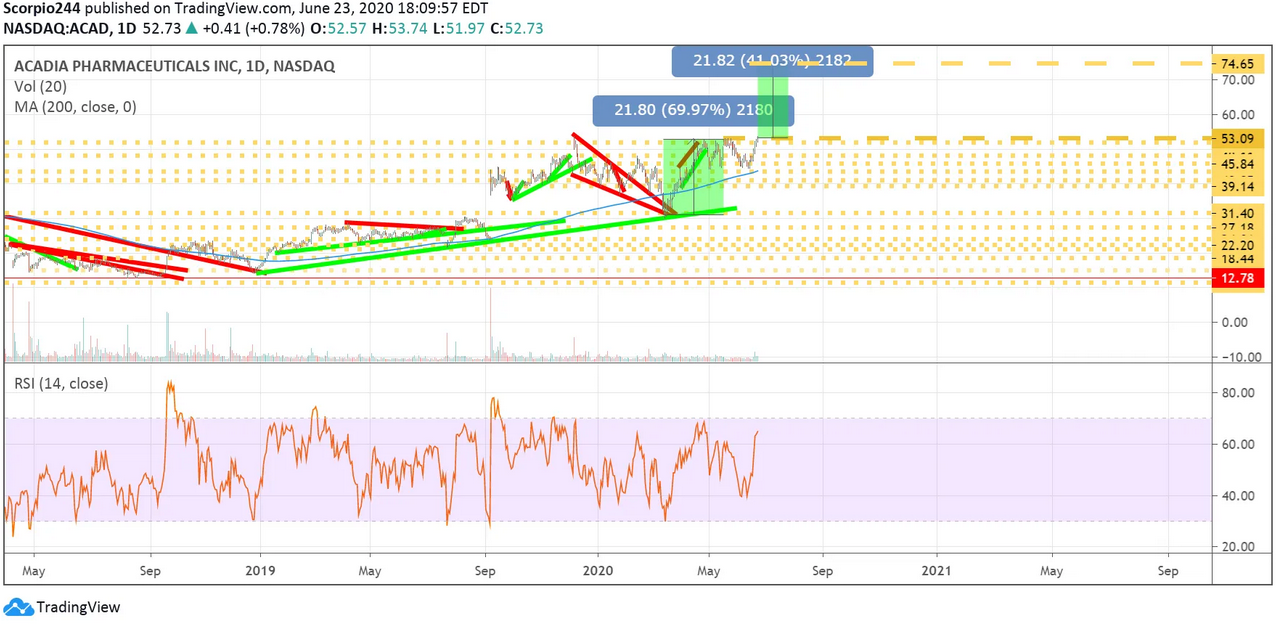
Acadia Inc Daily Chart

Original Post

Latest comments

thank you Michael
The thing happening might be covid 2nd wave about to break.
There’ll be no lockdown, period. That measure was artificial, they panicked, lesson learned
No lockdown, but very limited pro sports with crowds (incl NFL), travel, casinos, movies, malls, hospitality, restaurants, and most importantly, many people will still be working, learning, shopping and going to Drs from home when possible: ZM, CRWD, AMZN, SHOP, CHGG, TWLO, TDOC, ETSY, OKTA, TER, XBI, IBB. Forget about the reopening trade and value stocks.
Risk Disclosure: Trading in financial instruments and/or cryptocurrencies involves high risks including the risk of losing some, or all, of your investment amount, and may not be suitable for all investors. Prices of cryptocurrencies are extremely volatile and may be affected by external factors such as financial, regulatory or political events. Trading on margin increases the financial risks.
Before deciding to trade in financial instrument or cryptocurrencies you should be fully informed of the risks and costs associated with trading the financial markets, carefully consider your investment objectives, level of experience, and risk appetite, and seek professional advice where needed.
Fusion Media would like to remind you that the data contained in this website is not necessarily real-time nor accurate. The data and prices on the website are not necessarily provided by any market or exchange, but may be provided by market makers, and so prices may not be accurate and may differ from the actual price at any given market, meaning prices are indicative and not appropriate for trading purposes. Fusion Media and any provider of the data contained in this website will not accept liability for any loss or damage as a result of your trading, or your reliance on the information contained within this website.
It is prohibited to use, store, reproduce, display, modify, transmit or distribute the data contained in this website without the explicit prior written permission of Fusion Media and/or the data provider. All intellectual property rights are reserved by the providers and/or the exchange providing the data contained in this website.
Fusion Media may be compensated by the advertisers that appear on the website, based on your interaction with the advertisements or advertisers.
© 2007-2024 - Fusion Media Limited. All Rights Reserved.