Get 40% Off
🚨 Volatile Markets? Find Hidden Gems for Serious Outperformance
Find Stocks Now

Stocks Rise Yet Again, But Signs Of A Pullback Are Still On The Horizon

Published 01/17/2020, 12:37 AM
Updated 09/20/2023, 06:34 AM

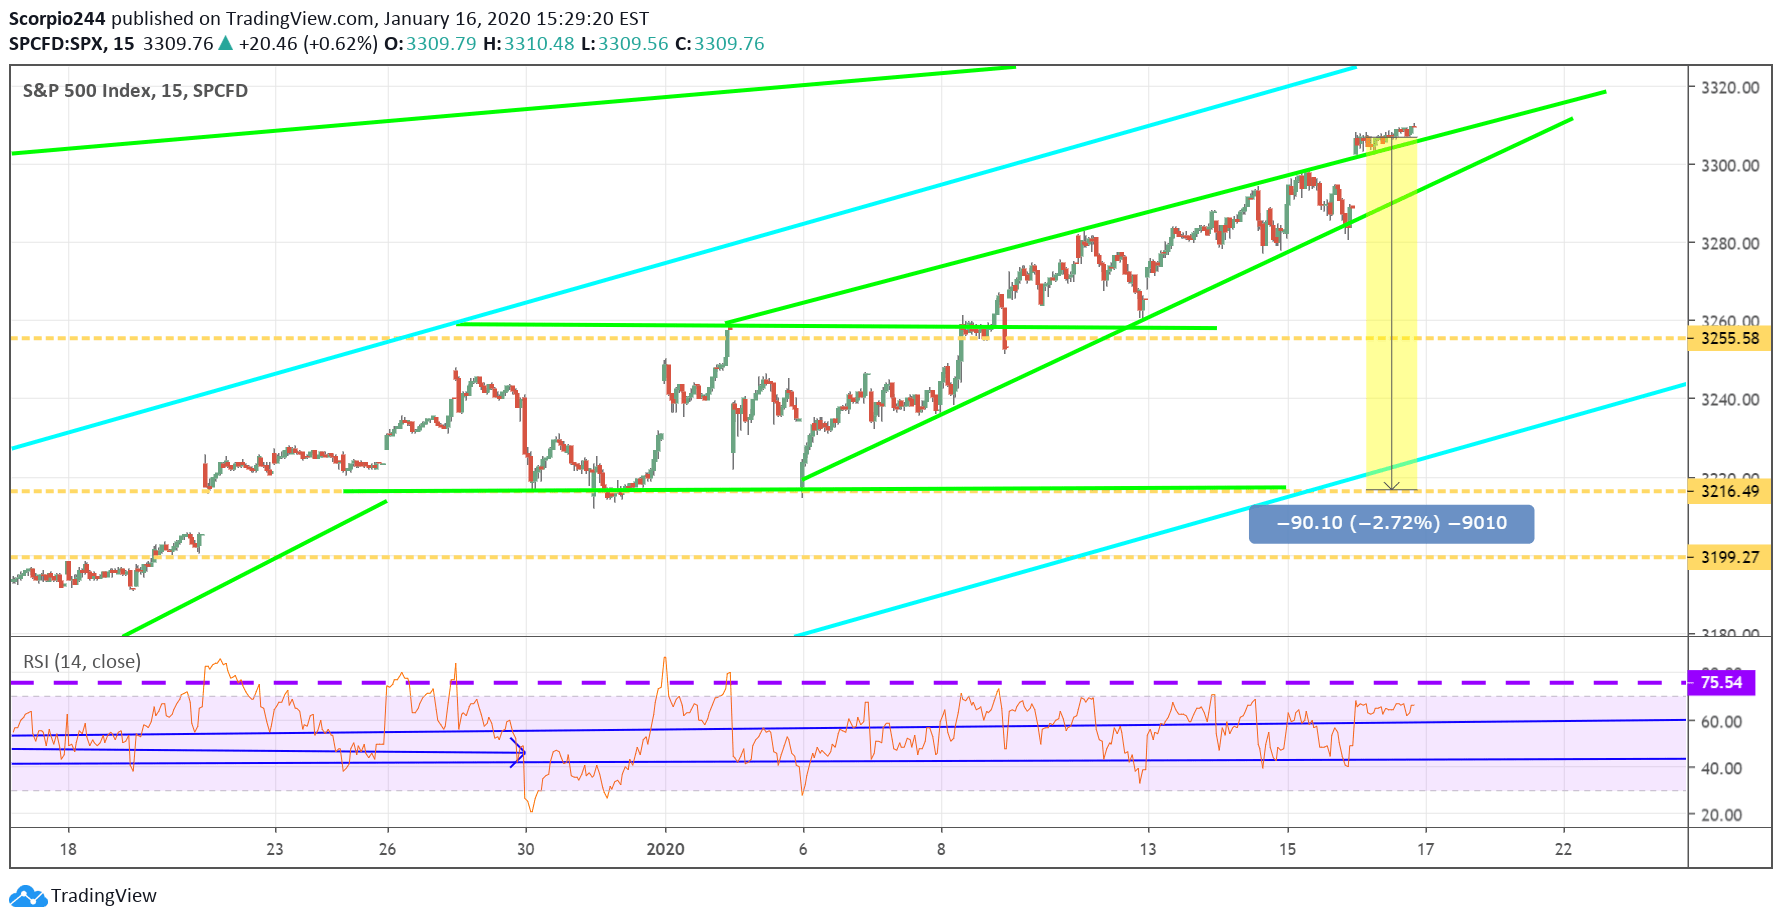
Anyway, at this point, the market continues grinding higher. It is making my belief of a pullback seem less likely at this point, or the very least being wrong. But it may be too early to admit defeat; we will have to wait to see what the next day or two bring.

The chart shows the rising wedge I drew in; it also indicates that the index trading higher slightly above the uptrend line. There is also now a gap that needs to be filled at lower levels around 3,290.
S&P 500 Index Chart

Russell 2000

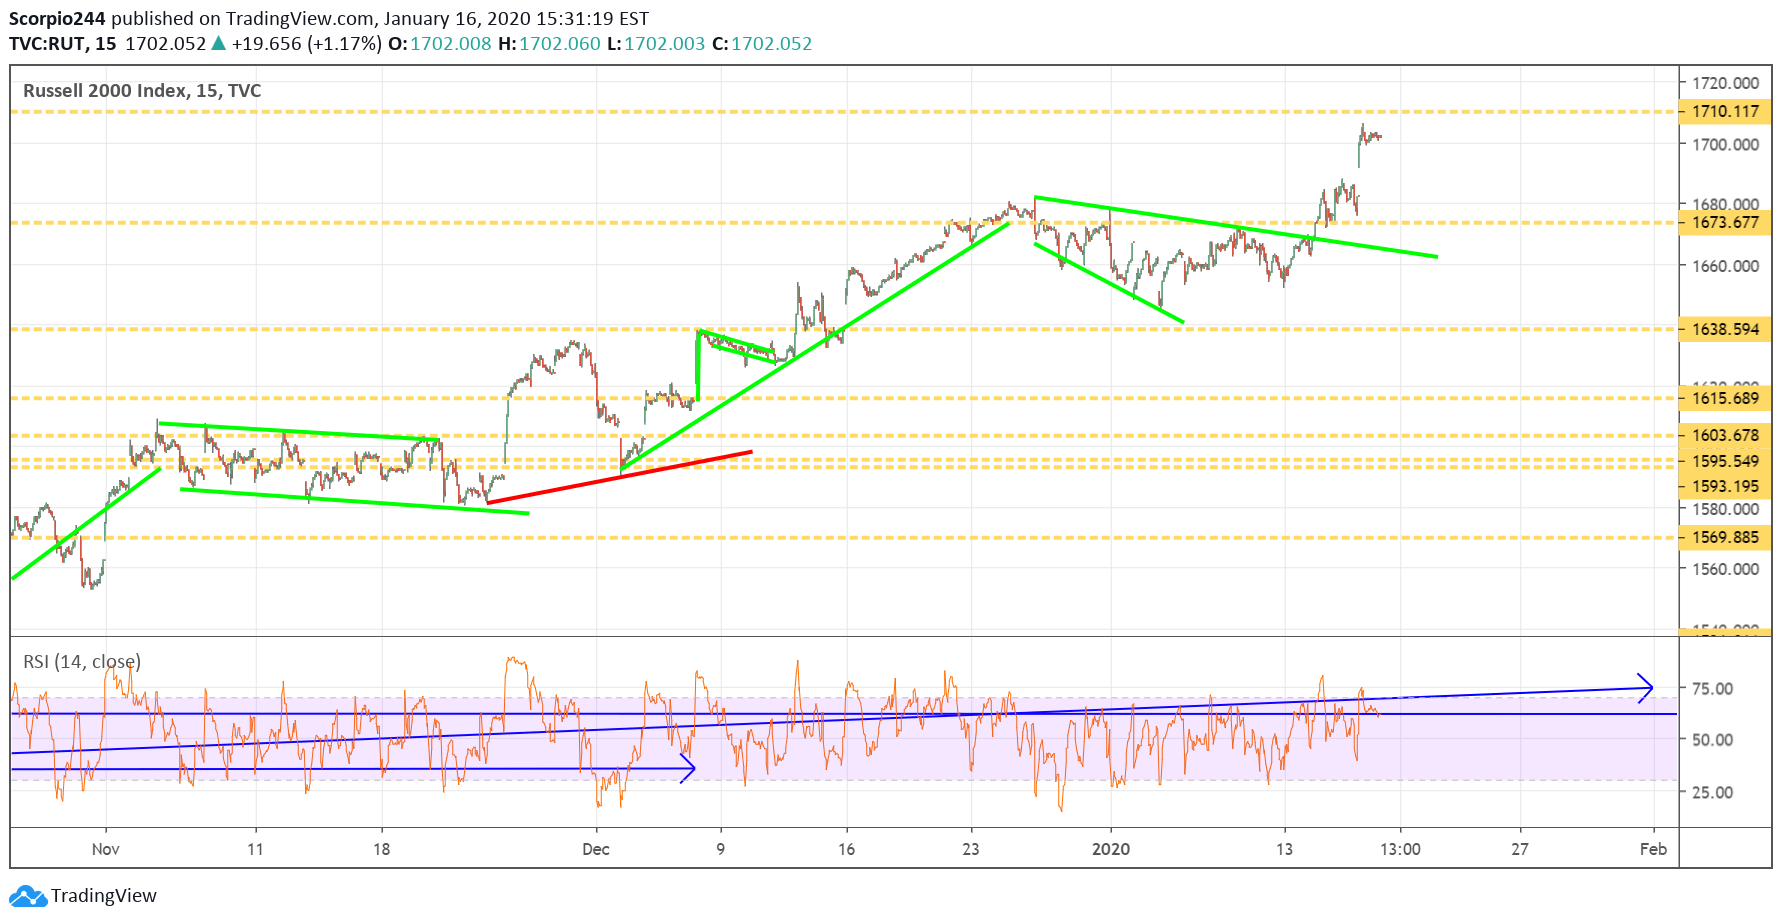
The Russell also made a new 52-week high today rising just above 1700. This is a region of resistance for the index in the 1,700 to 1,710 area. We can see there is a gap to fill in the Russell back around the 1680 level.
Russell 2000 Index Chart

200 Day Moving Average

S&P 500 - 200 Day Moving Average

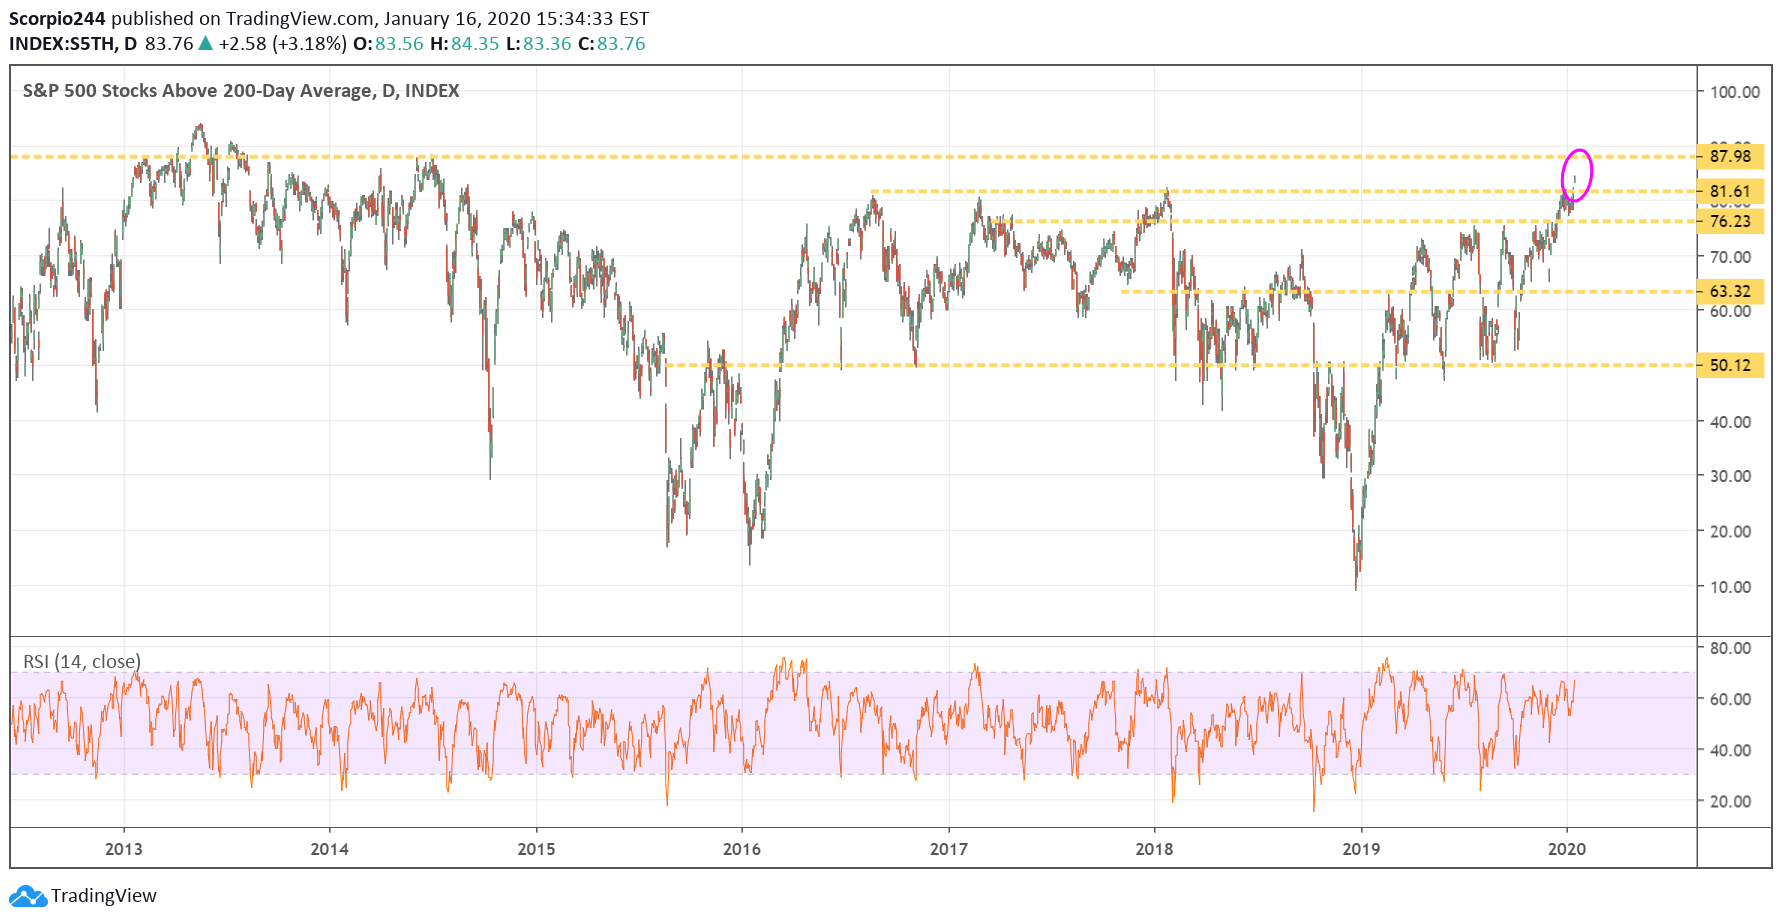
Additionally, one would have to go back to 2014, to find the last time the there were this many numbers of stocks above their 200 days moving average.

Twitter (TWTR)
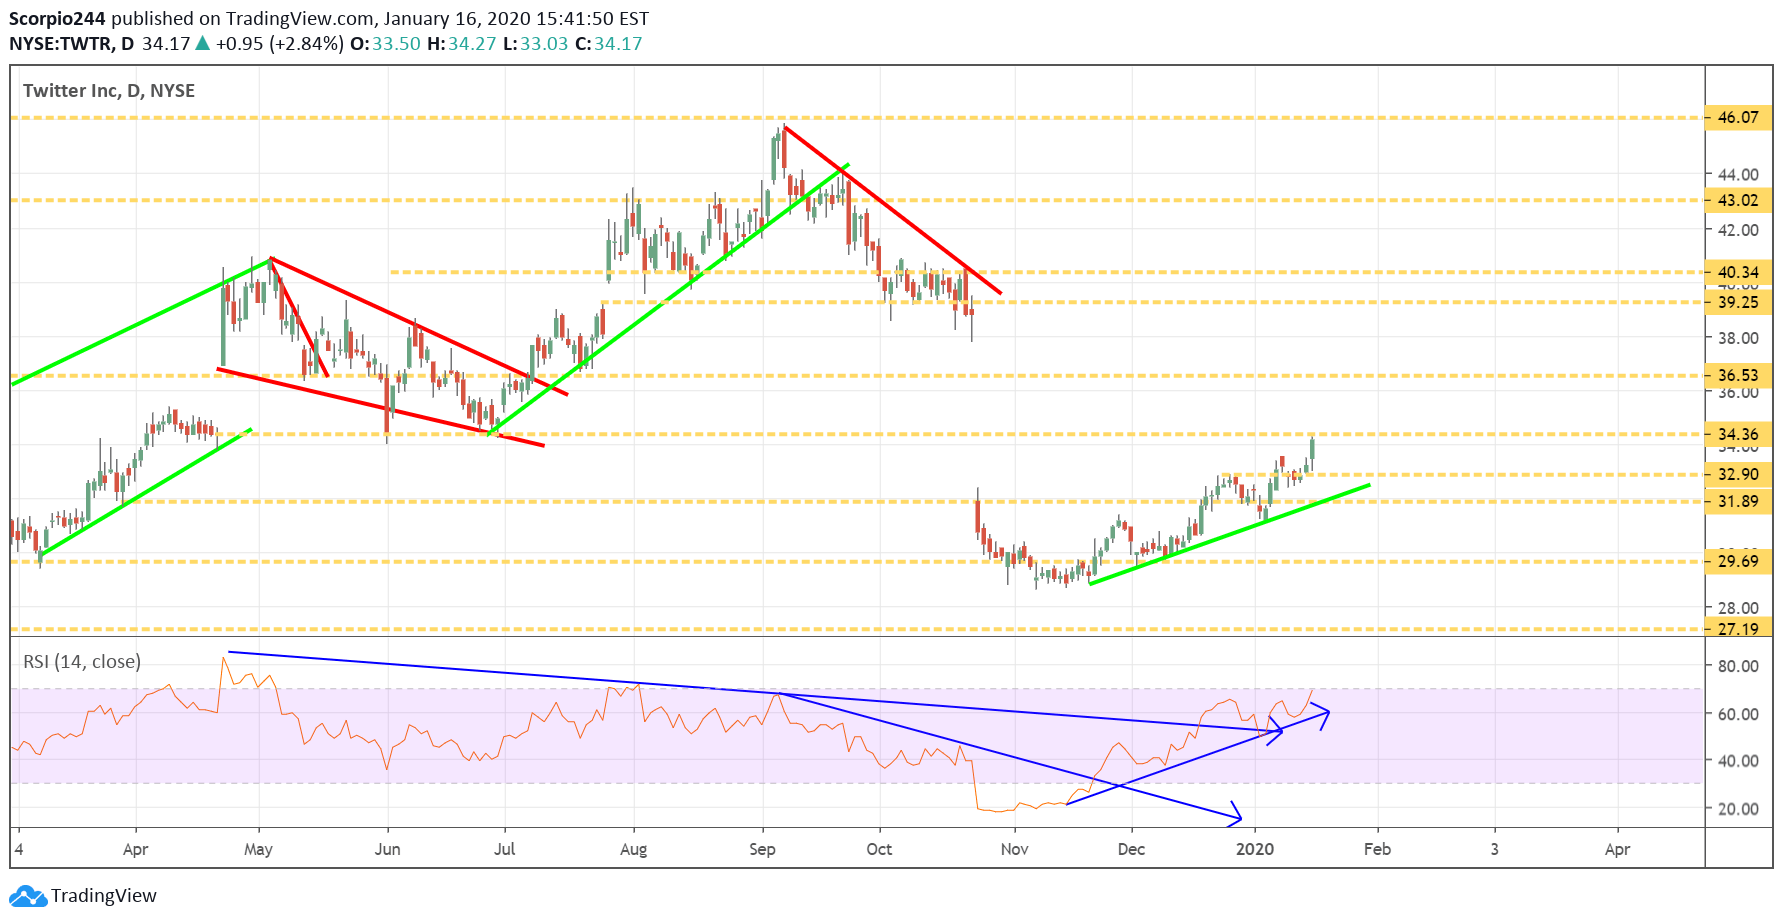
Twitter Daily Chart

Twitter is moving higher to resistance; this is a stock I was bullish on, then I turned bearish on. I should have just stuck with my original thought of the stock rising.

Roku (ROKU)
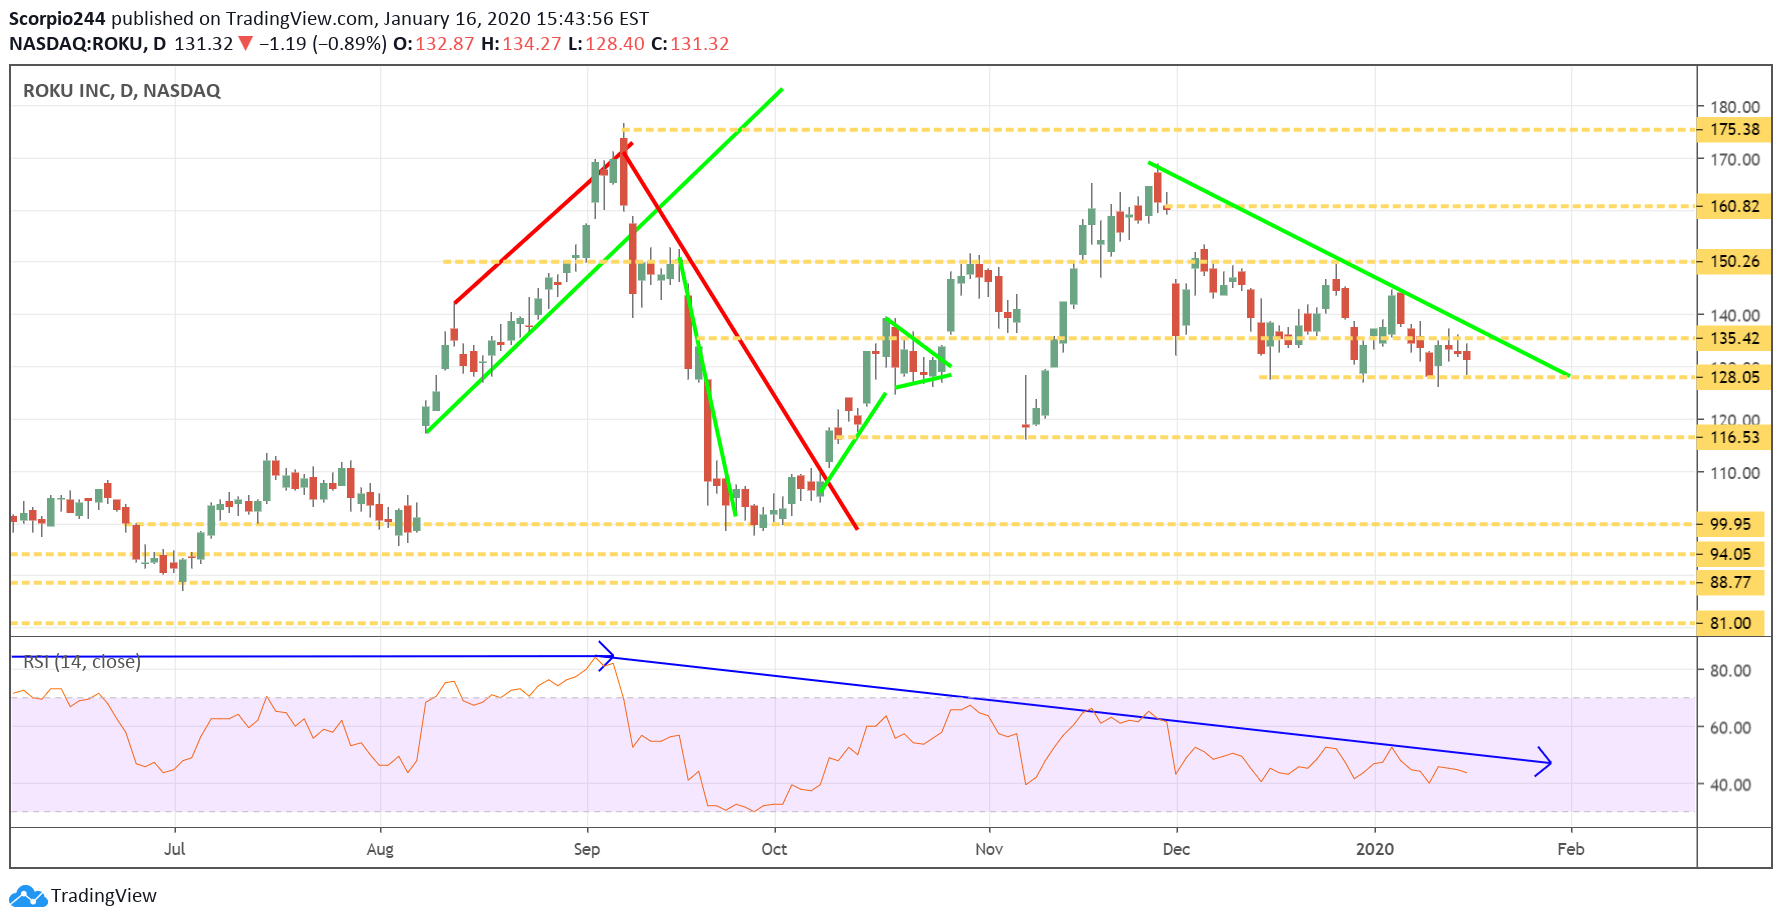
Roku Daily Chart

Here is another stock I always seem to struggle with, Roku. The stock is at support once again at $128, and still, it manages to hold.

Gilead (NASDAQ:GILD)

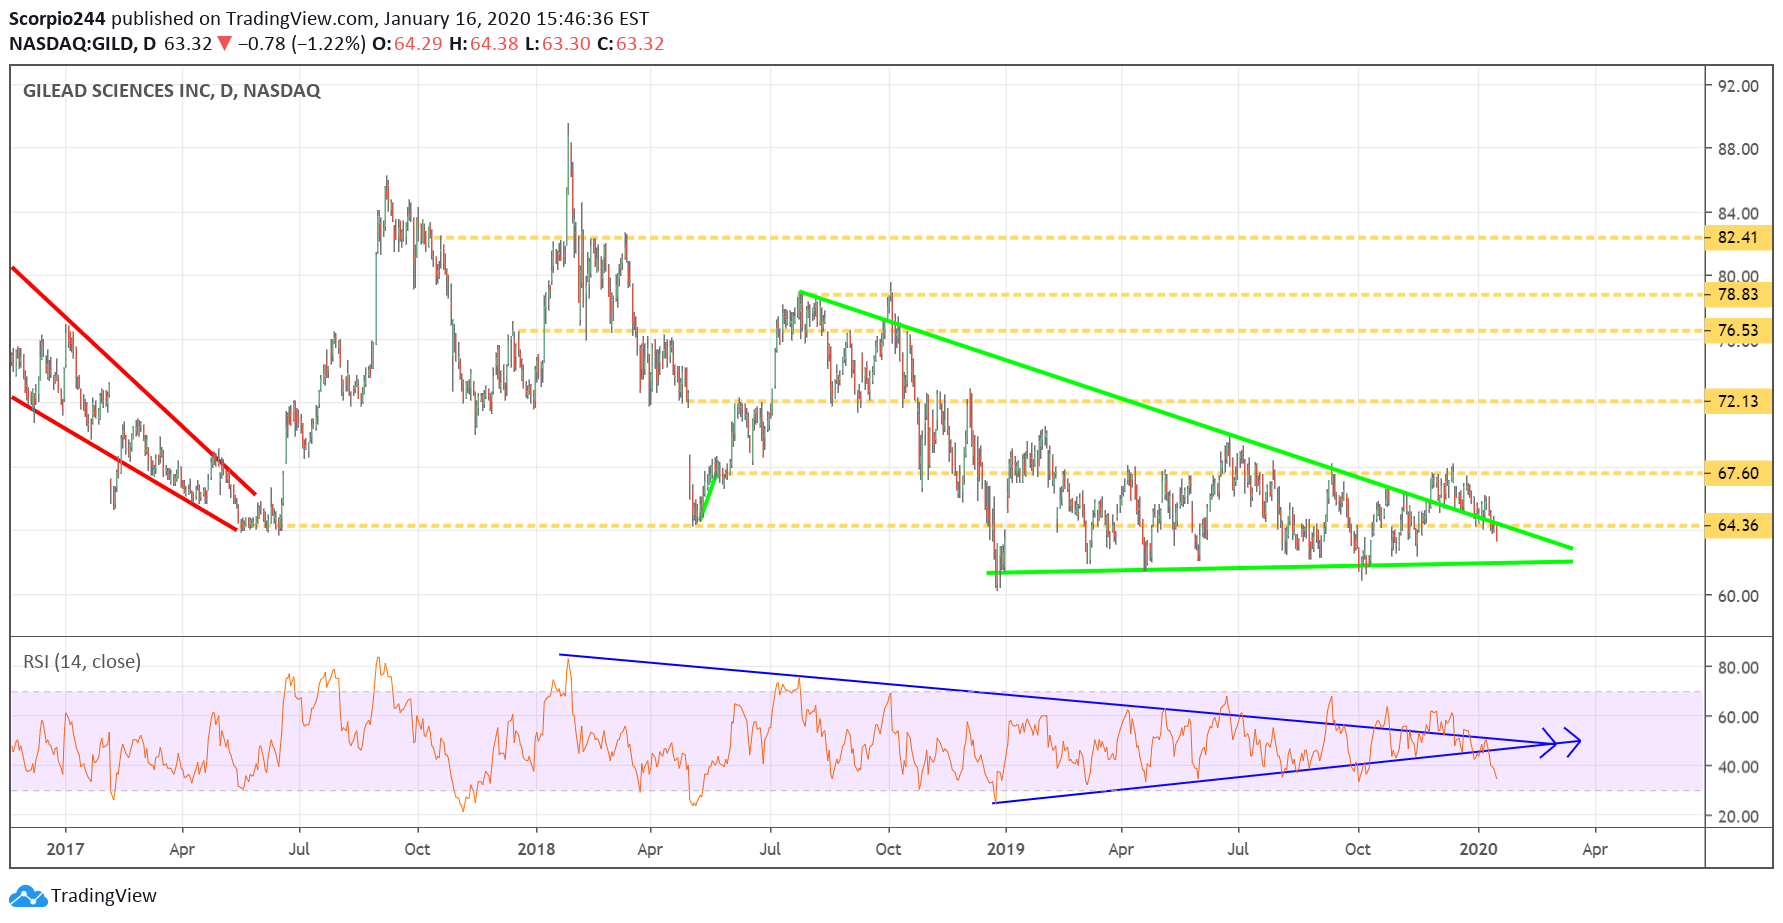
Since we are the topic of stocks I can’t get right, we might as well keep going. Today it is Gilead (NASDAQ:GILD), first I thought the stock was going lower, then I thought the stock was breaking out, now it is going the other way. It needs to hold support at $61.88.
3rd party Ad. Not an offer or recommendation by Investing.com. See disclosure here or remove ads .
GILD Daily Chart

Goldman (GS)

Goldman Sachs Inc Daily Chart

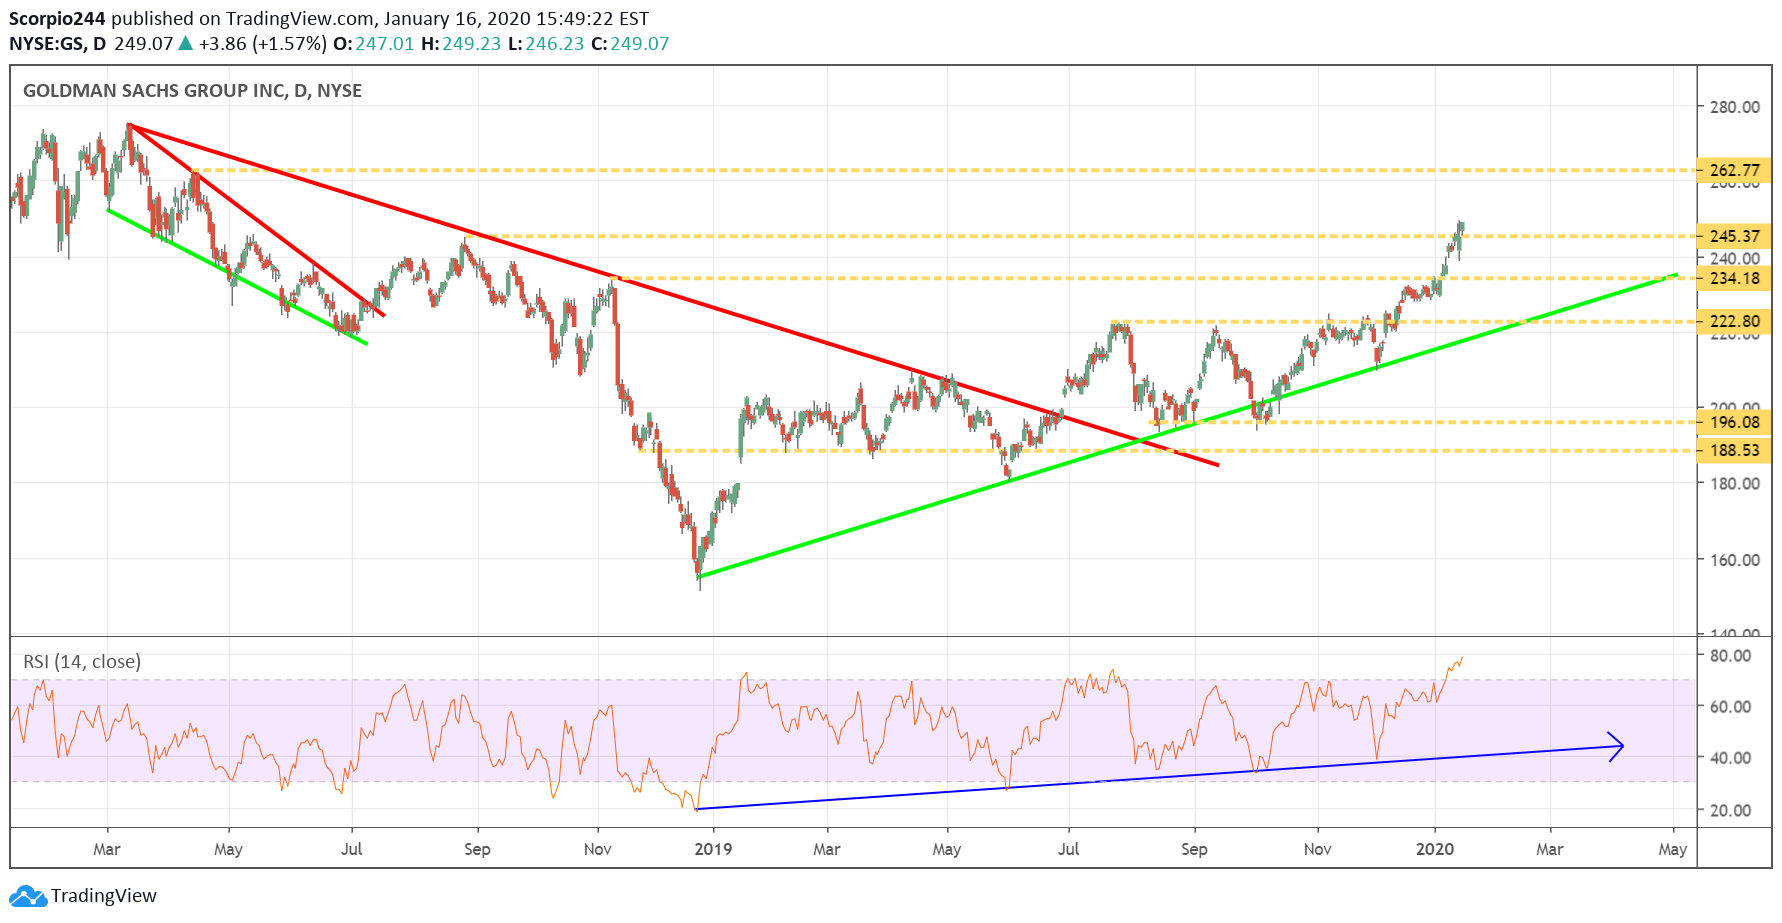
I am moving on. Goldman looks like it breaking out, rising above resistance, and the potential to push higher towards $263.

Blackberry (TSX:BB)
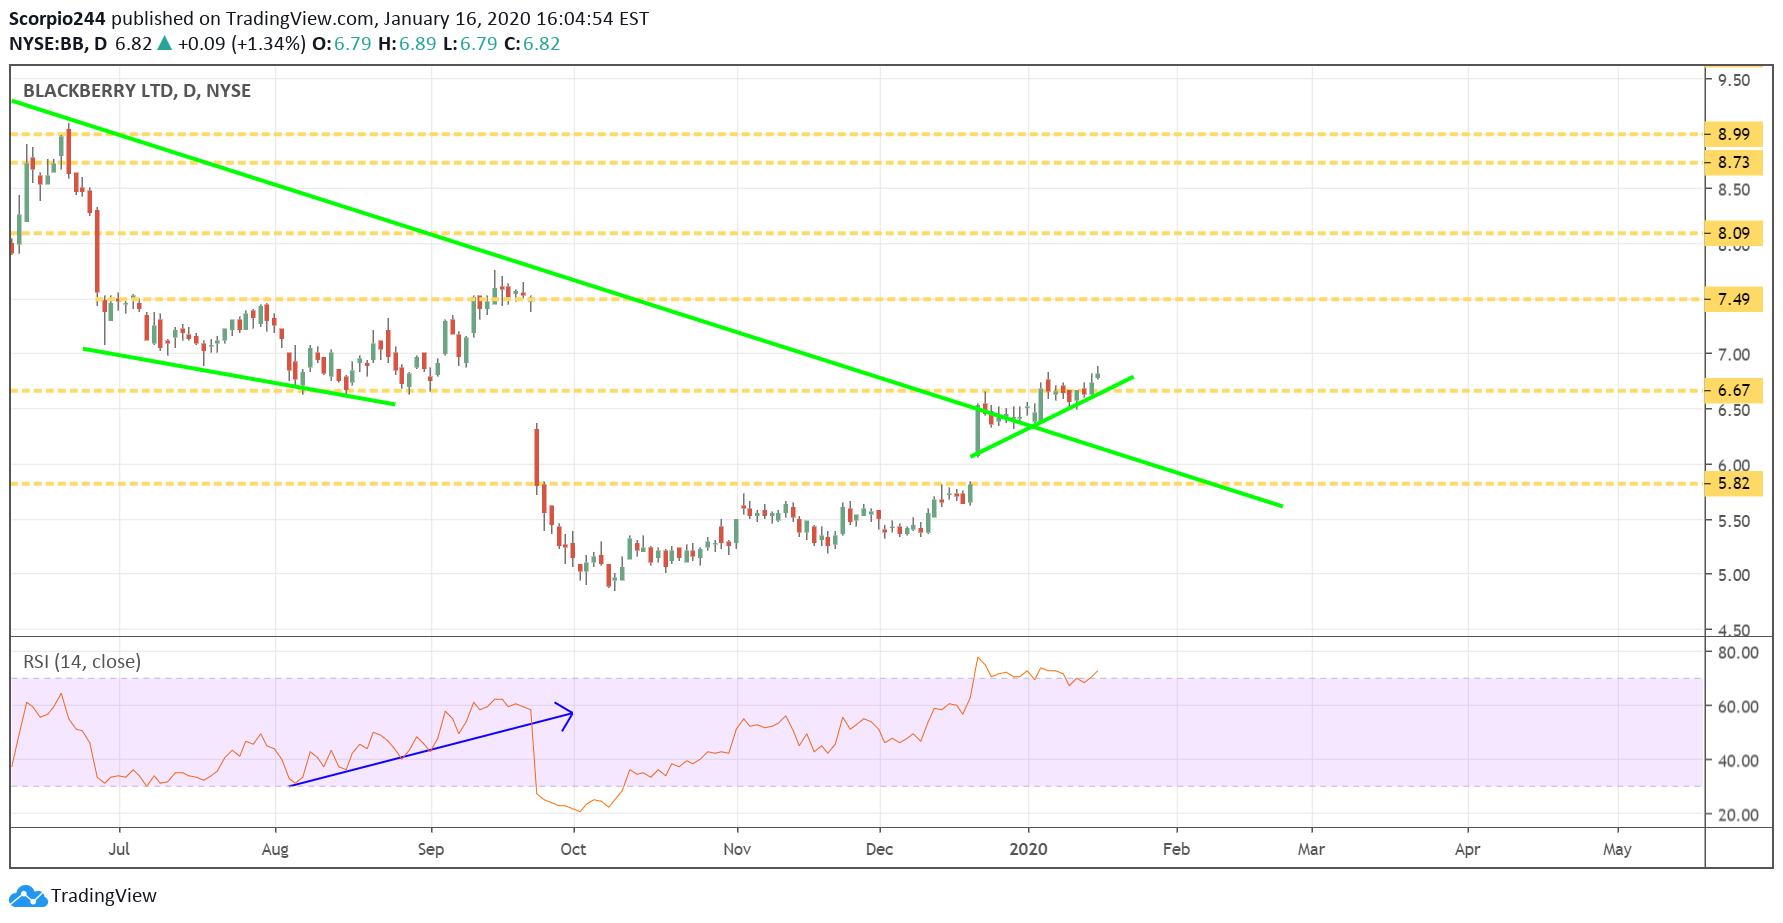
Blackberry Daily Chart

Here is one that had a good day, with Blackberry (TSX:BB) rising above a resistance level at $6.70, another good day tomorrow, we could result in the process of that gap fill up to $7.50.

Original Post

Latest comments

Risk Disclosure: Trading in financial instruments and/or cryptocurrencies involves high risks including the risk of losing some, or all, of your investment amount, and may not be suitable for all investors. Prices of cryptocurrencies are extremely volatile and may be affected by external factors such as financial, regulatory or political events. Trading on margin increases the financial risks.
Before deciding to trade in financial instrument or cryptocurrencies you should be fully informed of the risks and costs associated with trading the financial markets, carefully consider your investment objectives, level of experience, and risk appetite, and seek professional advice where needed.
Fusion Media would like to remind you that the data contained in this website is not necessarily real-time nor accurate. The data and prices on the website are not necessarily provided by any market or exchange, but may be provided by market makers, and so prices may not be accurate and may differ from the actual price at any given market, meaning prices are indicative and not appropriate for trading purposes. Fusion Media and any provider of the data contained in this website will not accept liability for any loss or damage as a result of your trading, or your reliance on the information contained within this website.
It is prohibited to use, store, reproduce, display, modify, transmit or distribute the data contained in this website without the explicit prior written permission of Fusion Media and/or the data provider. All intellectual property rights are reserved by the providers and/or the exchange providing the data contained in this website.
Fusion Media may be compensated by the advertisers that appear on the website, based on your interaction with the advertisements or advertisers.
© 2007-2024 - Fusion Media Limited. All Rights Reserved.