Get 40% Off
🔥 This hedge fund gained 26.16% in the last month. Get their top stocks with our free stock ideas tool.See stock ideas

Stocks Rise Sharply On April 6, Now We Wait For Confirmation

Published 04/07/2020, 02:53 AM
US500
-
AAPL
-
AMZN
-
TXN
-
V
-
VIX
-
BABA
-

Stocks ran higher on April 6, with the S&P 500 jumping by about 7%, a significant gain. There seems to be some optimism that the curves are flattening. It appears to be happening in some parts of the world, like Italy, Germany, and Spain, it may be too early to get excited here in the US. The chart below clearly shows that the number of new cases is now falling in those three countries, but they are good 2 to 4 weeks ahead of the US. While I most want this to pass as soon as possible, I am cautiously optimistic and fear the market is getting ahead of itself.

The chart clearly shows that both Italy, Germany, and Spain had two waves in it. While I am most certainly not a Doctor or Statistician, I can read charts exceptionally well, and that seems clear as day to me, the double tops. So we can hope and pray, but let’s be careful still.
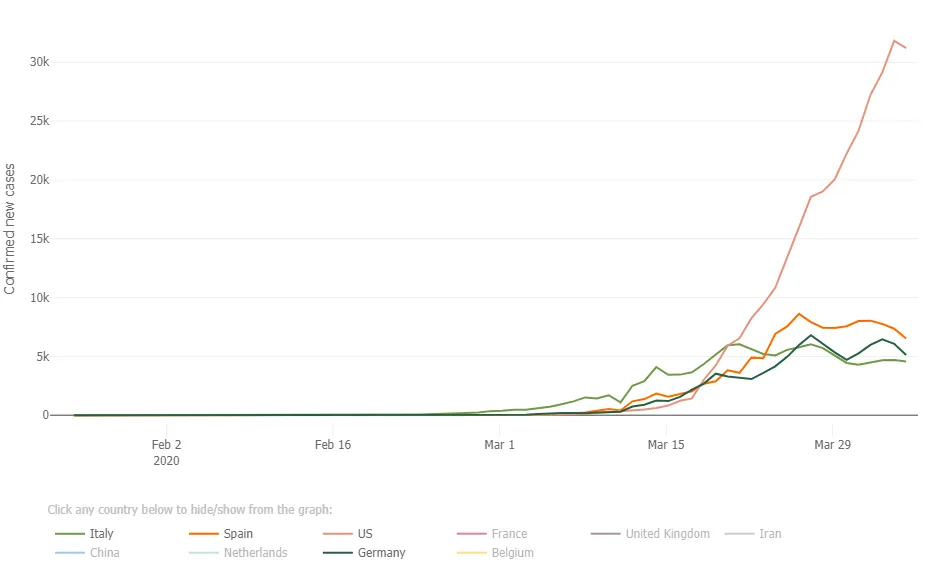
CoronaVirus Wave Chart

S&P 500 (SPY)

The S&P 500 was able to clear what I think was an essential level of resistance around the 2,630 regions, and that could suggest that we likely test 2,725. I’m not sticking my neck out here, though; we need to see confirmation that and follow through today. I was seeing a lot of bearish options betting on the S&P 500 and VIX.
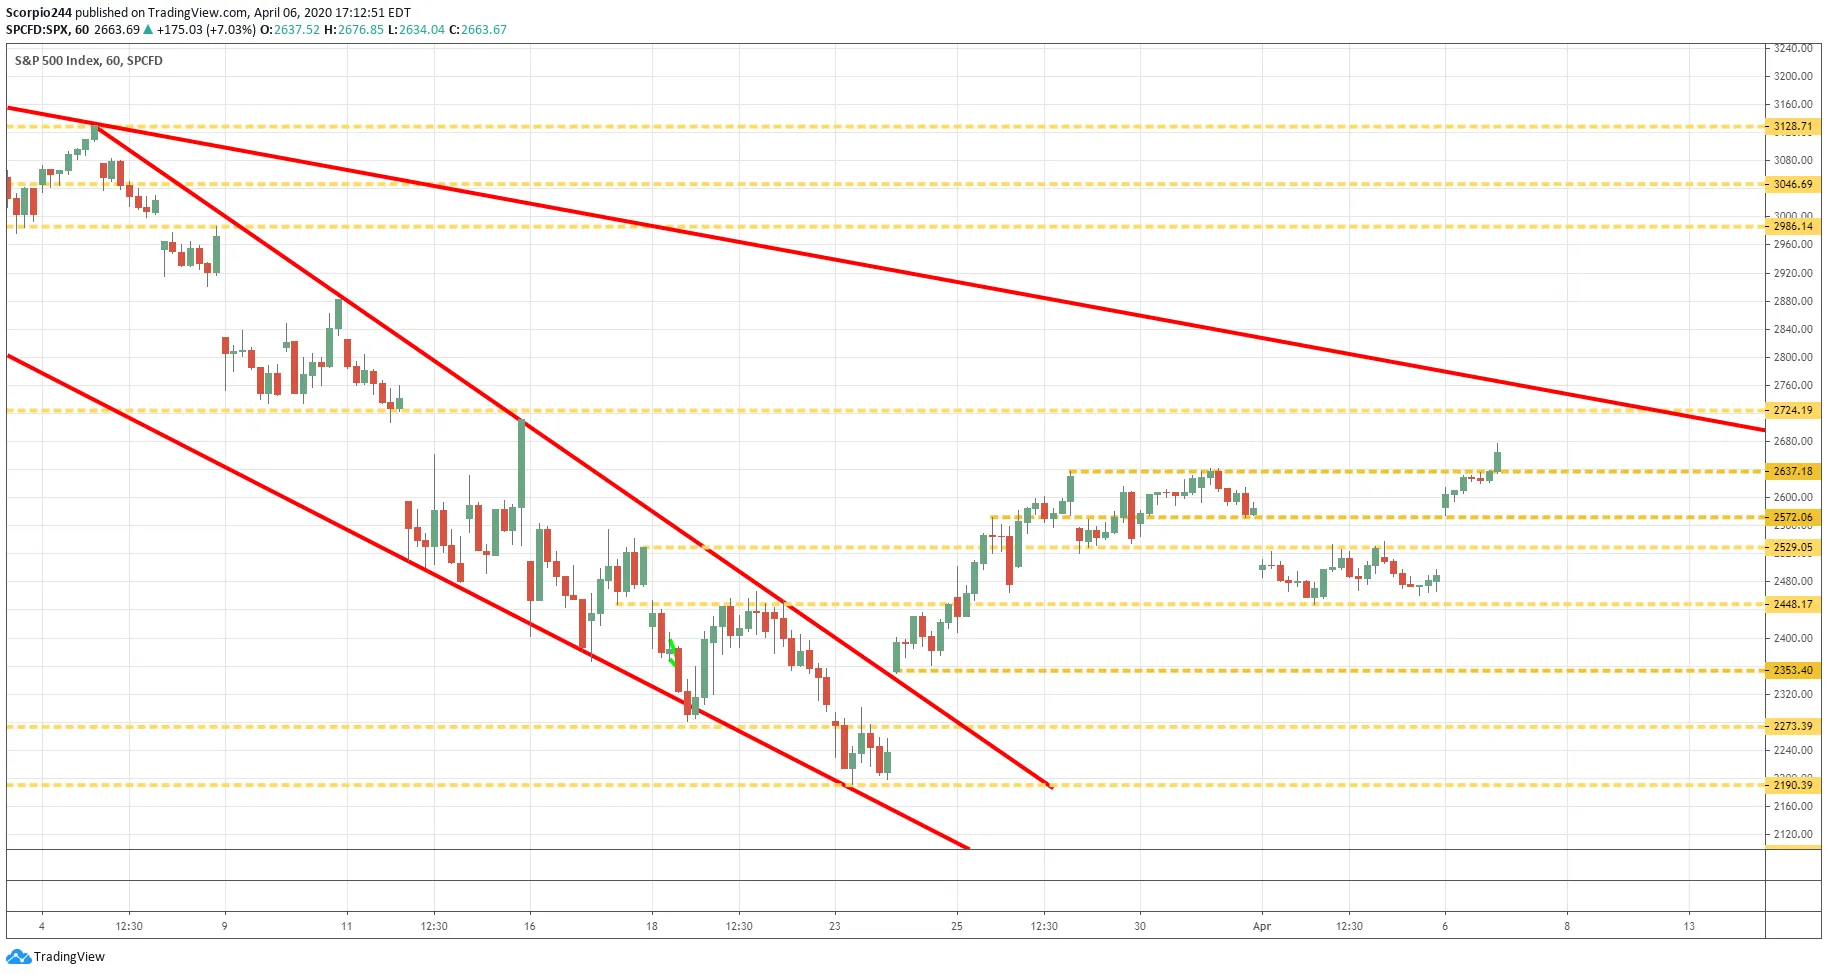
S&P 500 Chart

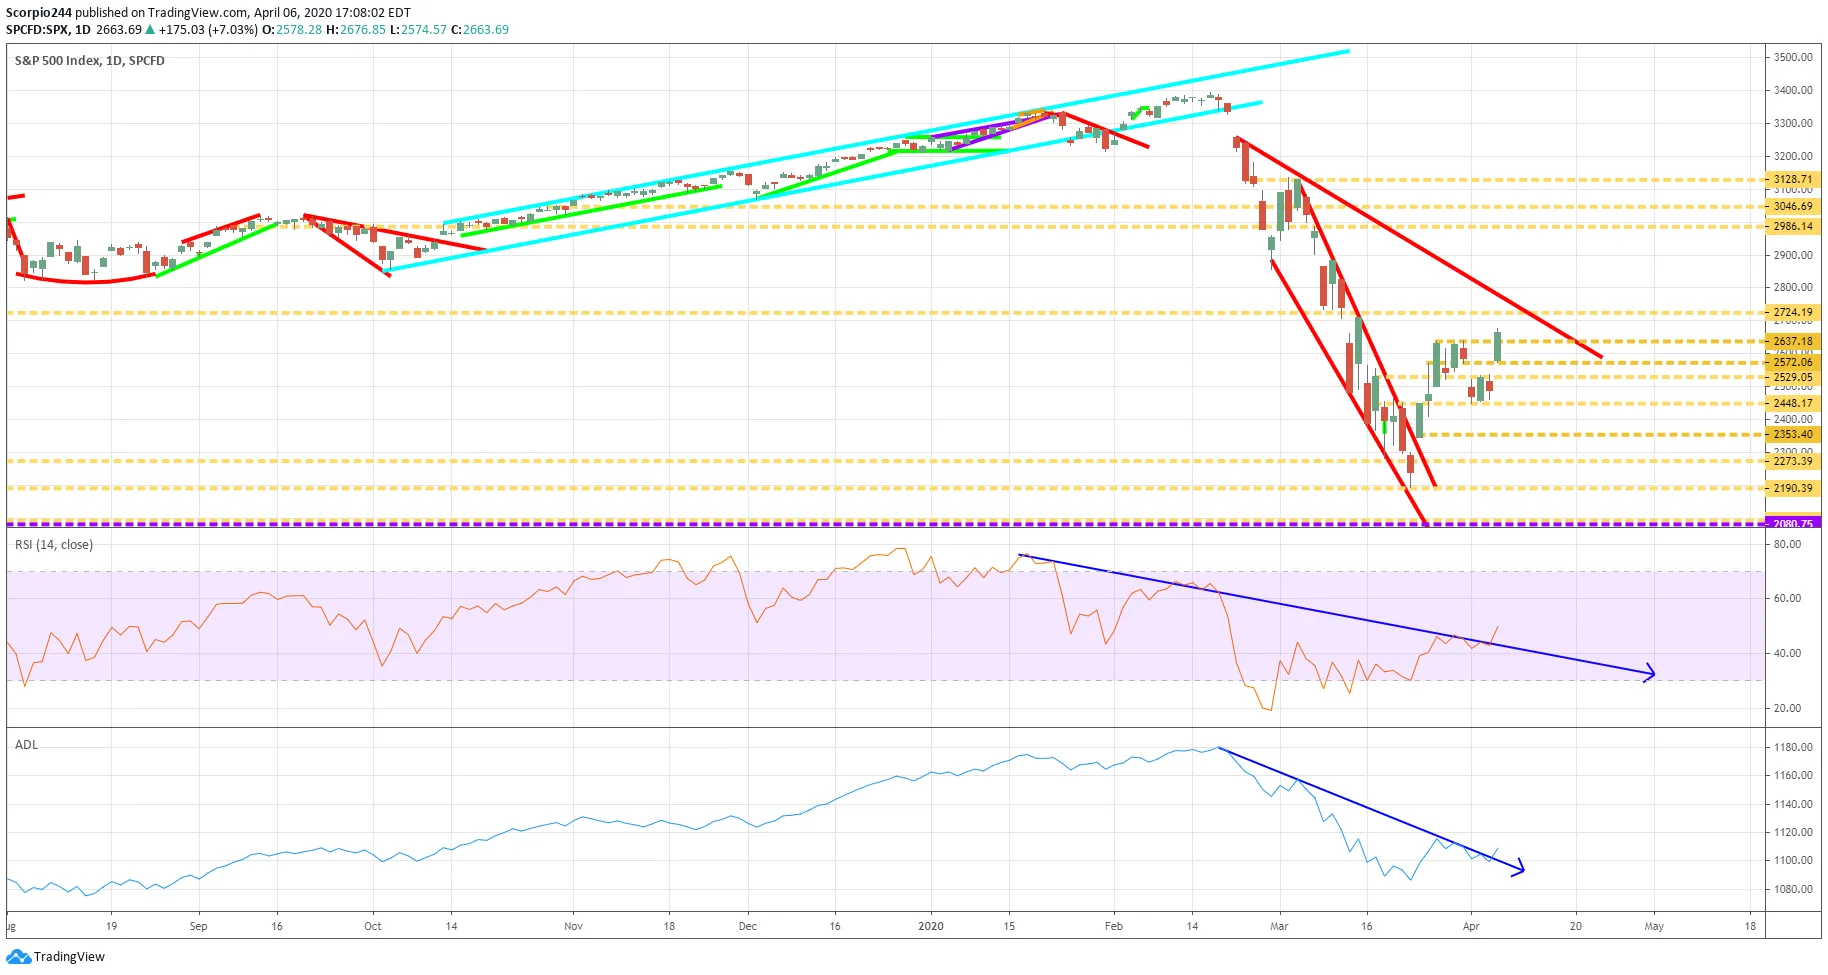
On the daily chart, we see that both the RSI and the advance/decline line appear to have broken a downtrend, barely. So again, today, we will need to see a confirmation and follow through.
3rd party Ad. Not an offer or recommendation by Investing.com. See disclosure here or remove ads .

S&P 500 Daily Chart

Apple (AAPL)

Apple (NASDAQ:AAPL) reached resistance at $257 yesterday and was also able to poke above it. Again, with confirmation today, it could probably rise to around $275.
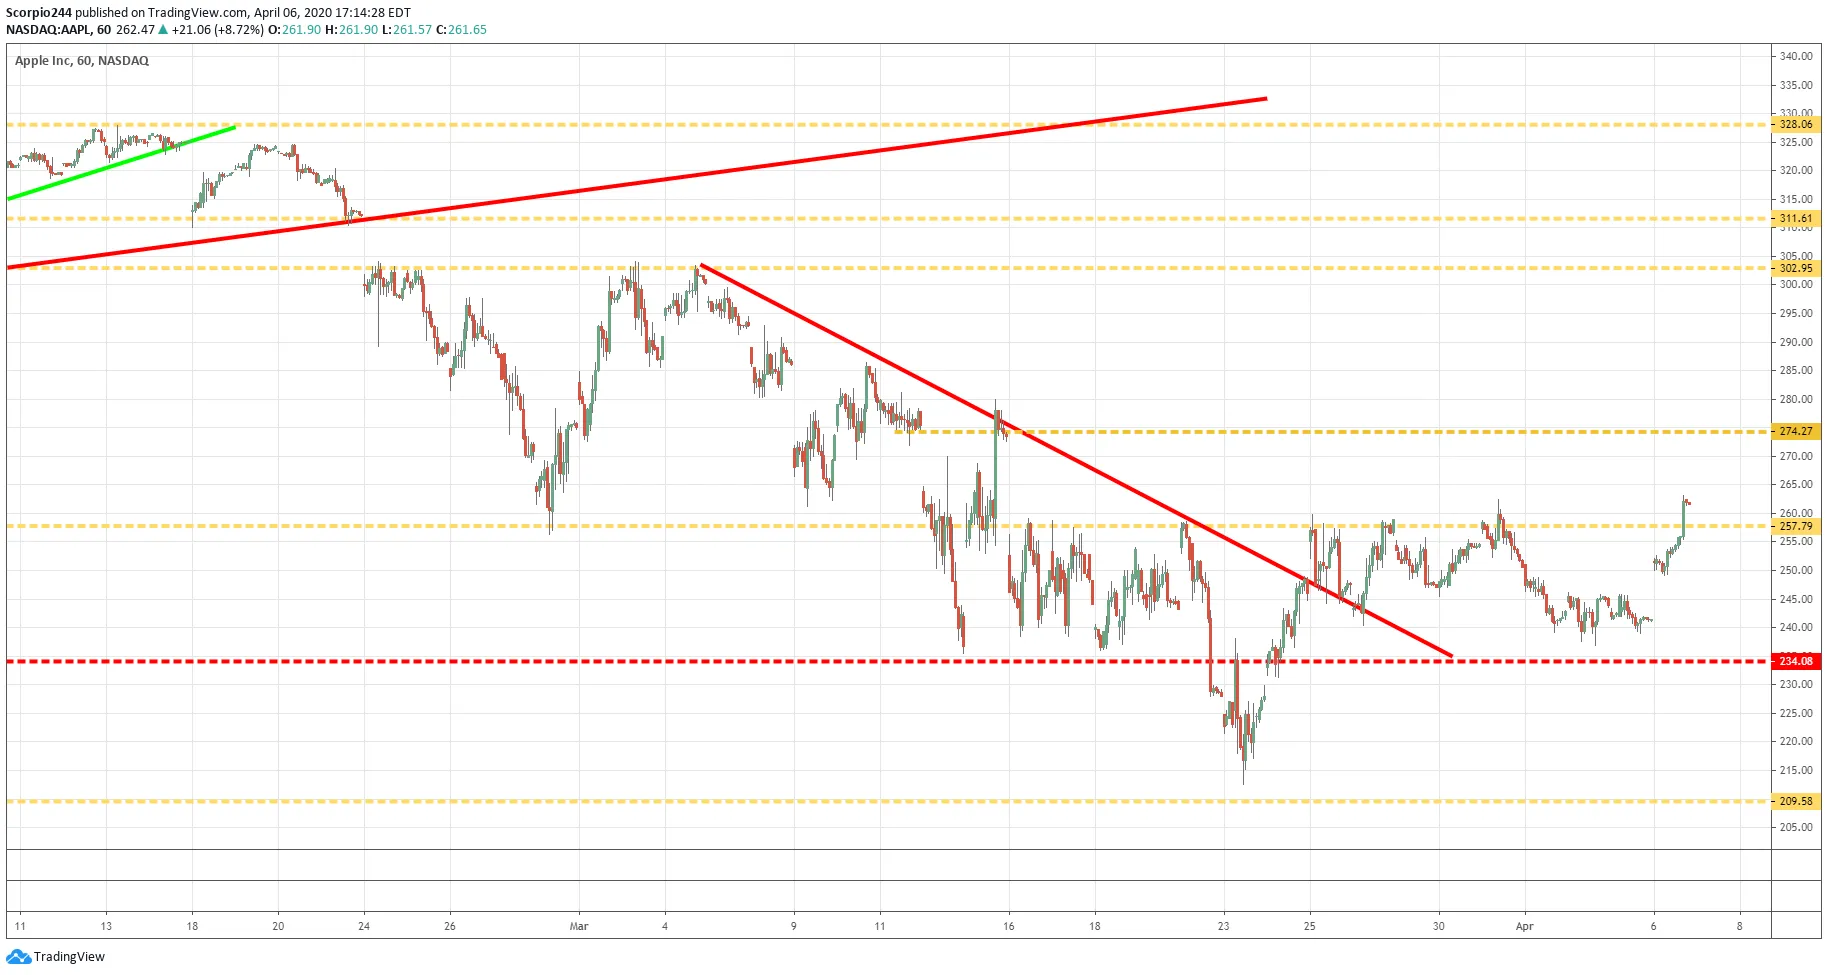
Apple Chart

Visa (V)

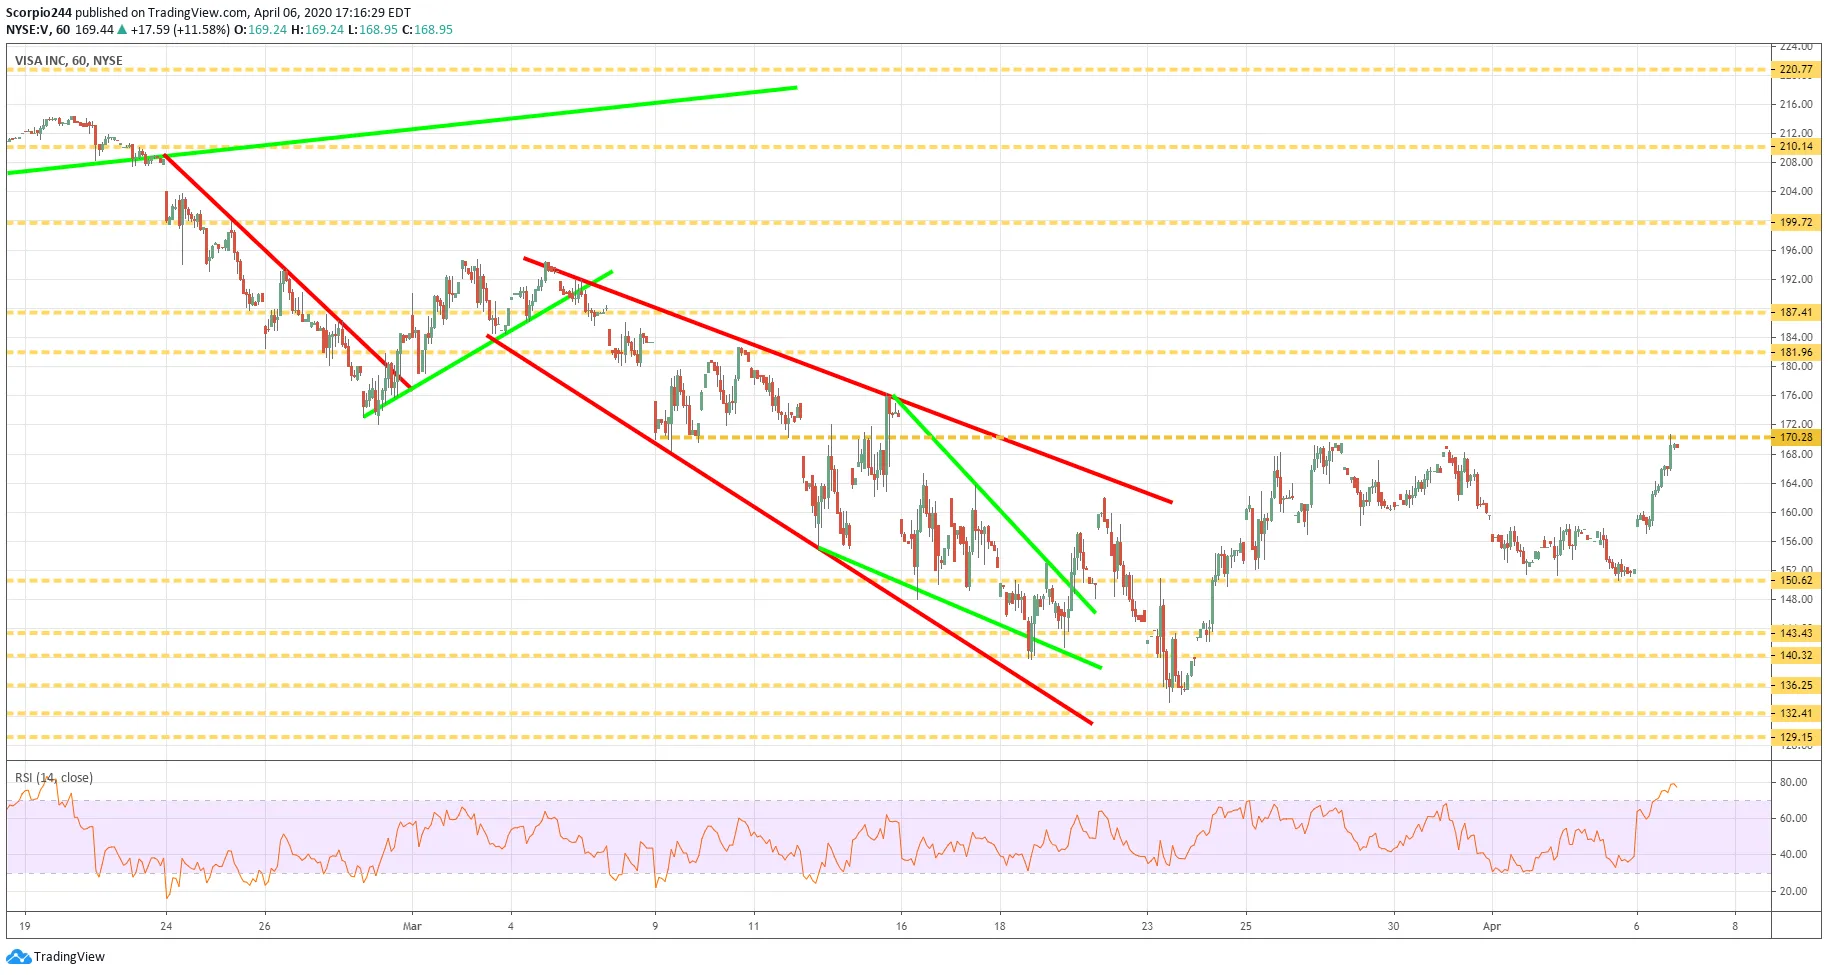
Visa (NYSE:V) rose sharply, reaching resistance at $170. I’m not sure the stock gets back over resistance today. If not, it falls back to $150.
Visa Chart

Amazon (AMZN)

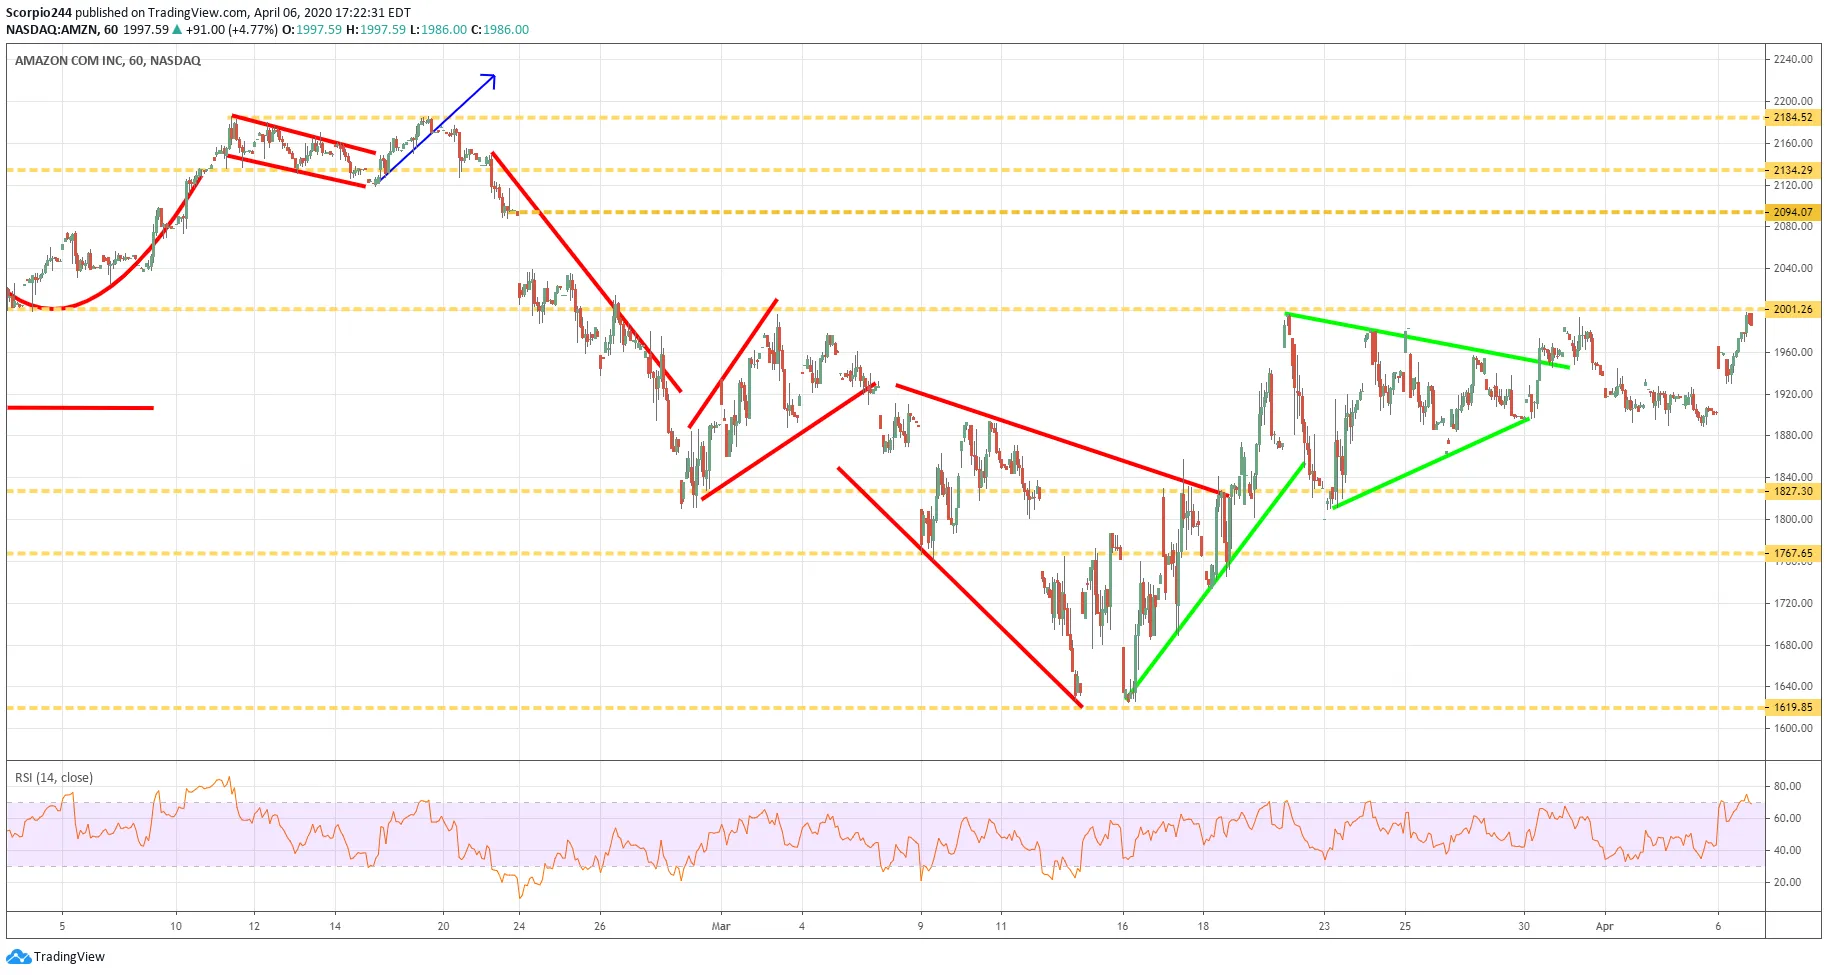
Amazon (NASDAQ:AMZN) was able to get back to resistance yesterday at $2000 and is where it stopped going up.
Amazon Chart

Texas Instruments (TXN)

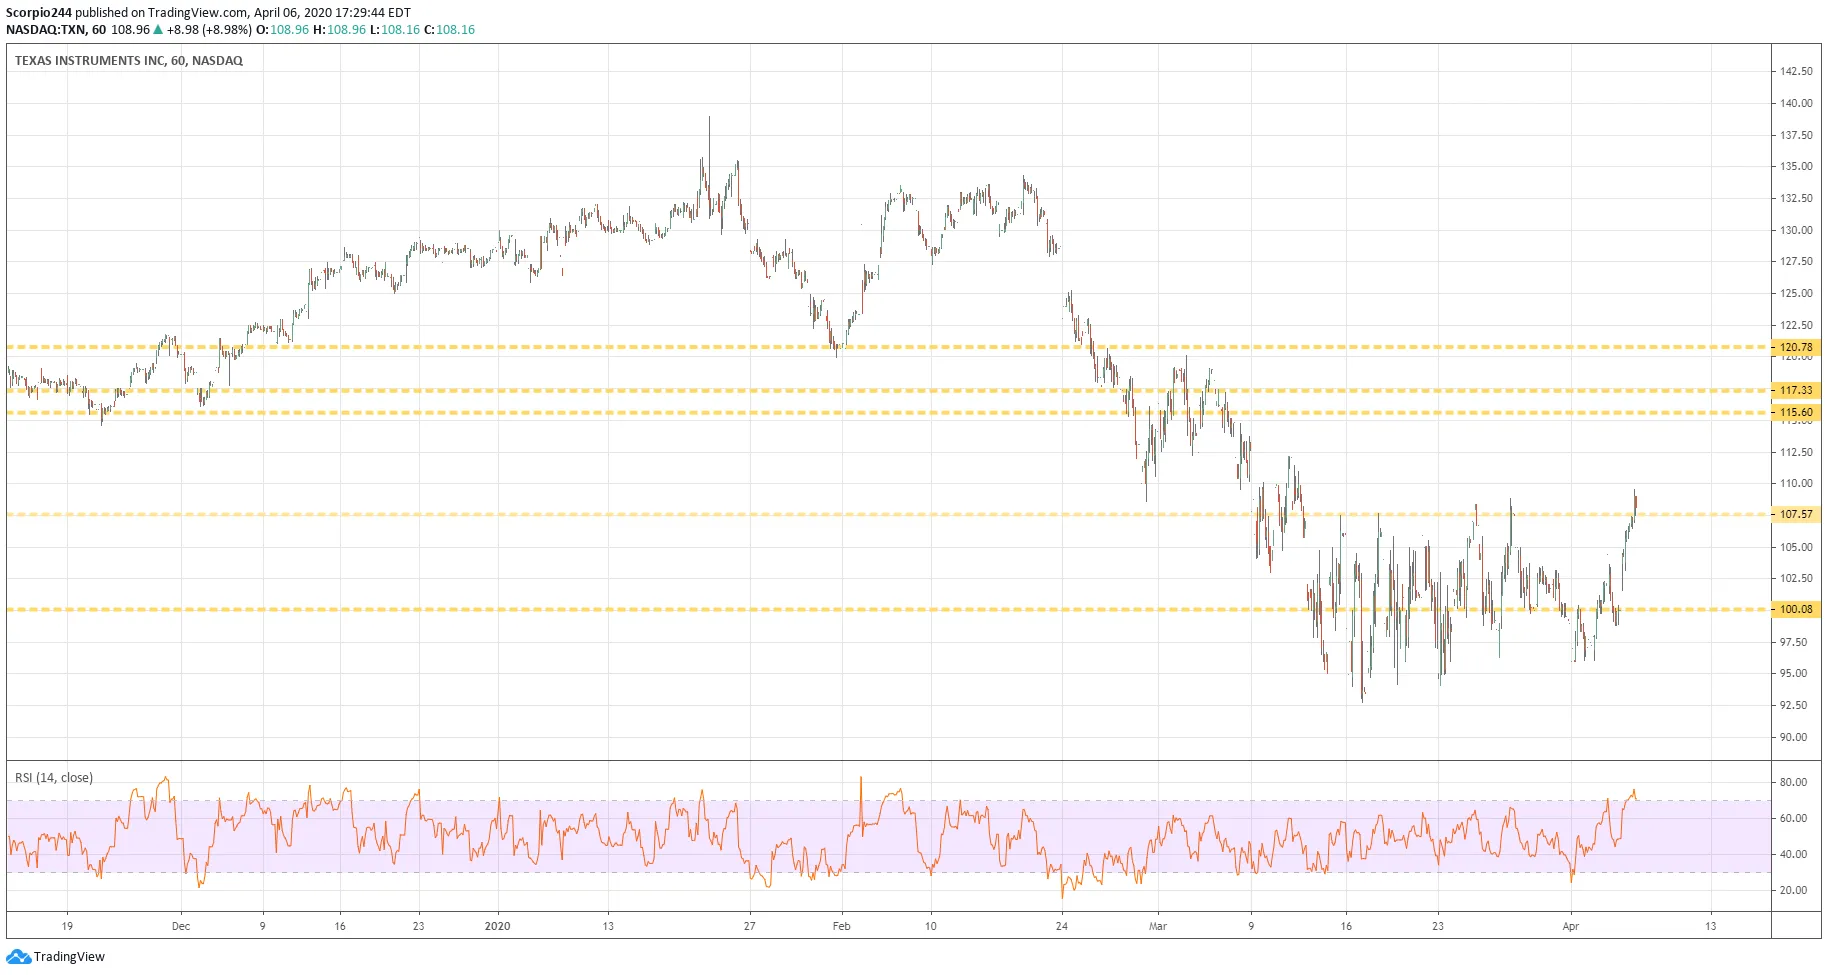
Maybe a good indicator of where things are going to go is Texas Instruments (NASDAQ:TXN), the stock also rose just above resistance yesterday, and again, if we get a follow-through today, it can probably go to $115.60.
Texas Instruments Chart

Alibaba (BABA)

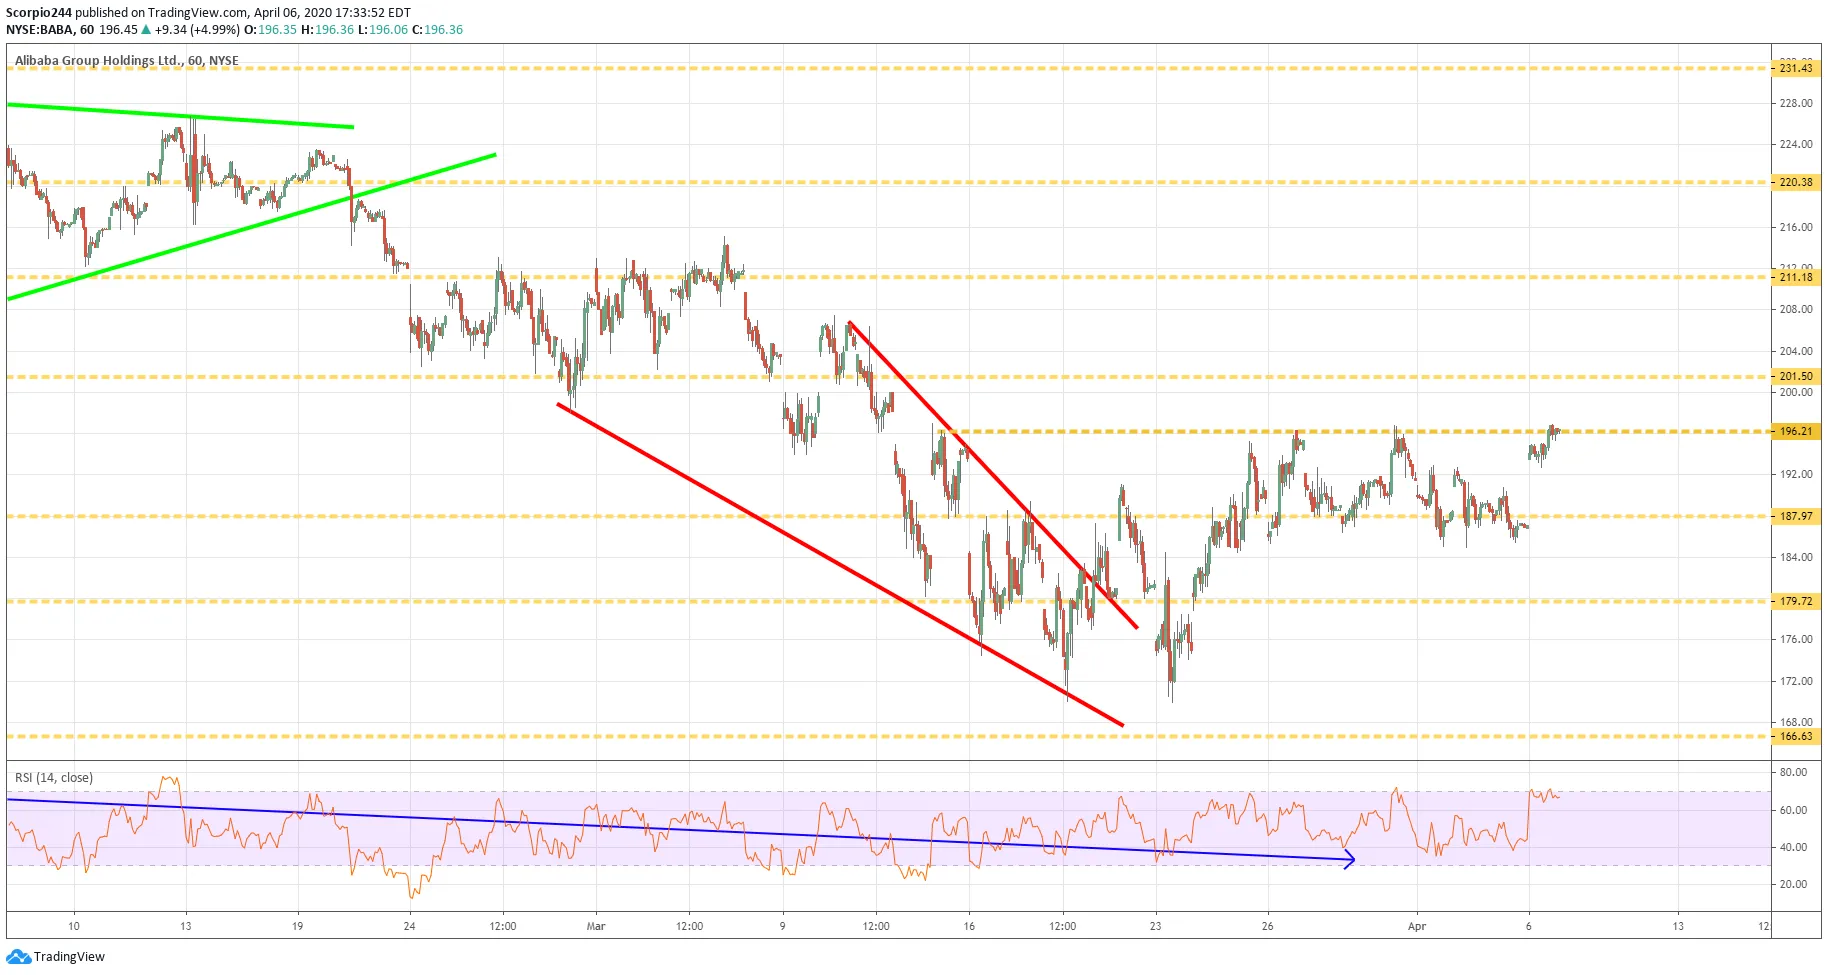
Alibaba (NYSE:BABA) needs to get over $197, or its risks going right back to $187.
Alibaba Chart

Original Post

Latest comments

This wont continue despite FED keep trying to save the economy The VIX is still sturbornly high. it is a obvious mean for the markwt
We’ve got our confirmation.... that somehow our economy is ticking away just as strongly as it had been last November. Palm to face. I guess that’s why they say bear market rallies retrace further than you would think is possible.
Risk Disclosure: Trading in financial instruments and/or cryptocurrencies involves high risks including the risk of losing some, or all, of your investment amount, and may not be suitable for all investors. Prices of cryptocurrencies are extremely volatile and may be affected by external factors such as financial, regulatory or political events. Trading on margin increases the financial risks.
Before deciding to trade in financial instrument or cryptocurrencies you should be fully informed of the risks and costs associated with trading the financial markets, carefully consider your investment objectives, level of experience, and risk appetite, and seek professional advice where needed.
Fusion Media would like to remind you that the data contained in this website is not necessarily real-time nor accurate. The data and prices on the website are not necessarily provided by any market or exchange, but may be provided by market makers, and so prices may not be accurate and may differ from the actual price at any given market, meaning prices are indicative and not appropriate for trading purposes. Fusion Media and any provider of the data contained in this website will not accept liability for any loss or damage as a result of your trading, or your reliance on the information contained within this website.
It is prohibited to use, store, reproduce, display, modify, transmit or distribute the data contained in this website without the explicit prior written permission of Fusion Media and/or the data provider. All intellectual property rights are reserved by the providers and/or the exchange providing the data contained in this website.
Fusion Media may be compensated by the advertisers that appear on the website, based on your interaction with the advertisements or advertisers.
© 2007-2024 - Fusion Media Limited. All Rights Reserved.