Get 40% Off
👀 👁 🧿 All eyes on Biogen, up +4,56% after posting earnings. Our AI picked it in March 2024.
Which stocks will surge next?
Unlock AI-picked Stocks

Stocks Rise And The VIX Rise As The Most Shorted Continue To Surge

Published 02/09/2021, 12:27 AM
Updated 09/20/2023, 06:34 AM

Stocks advanced yesterday, with the S&P 500’s last minutes pushing higher to close at 3,915. The index was fairly well-contained, trading below 3,910 all day with buyers stepping in for the final 30 minutes of trading, but with a powerful move right at the close.
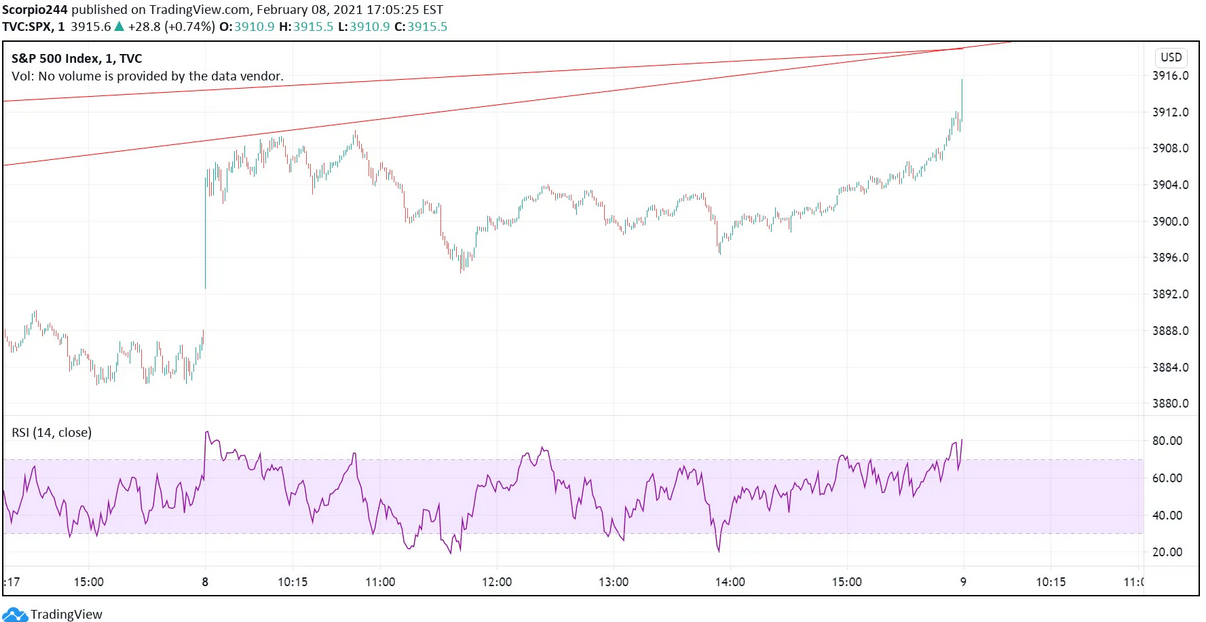
S&P 500 Index Chart

The most shorted indexed did manage to push higher by over 4%, and the Russell pushed higher by more than 2%. The move higher continues to be a short-squeeze of epic proportion with stocks like Sorrento (NASDAQ:SRNE), Fuel Cell (NASDAQ: OMX, and Novavax (NASDAQ:NVAX) leading the way. These are, of course, also in the Russell.

Most Shorted Stocks

I showed this chart in my weekend video for members of Reading The Markets, and it is stunning.
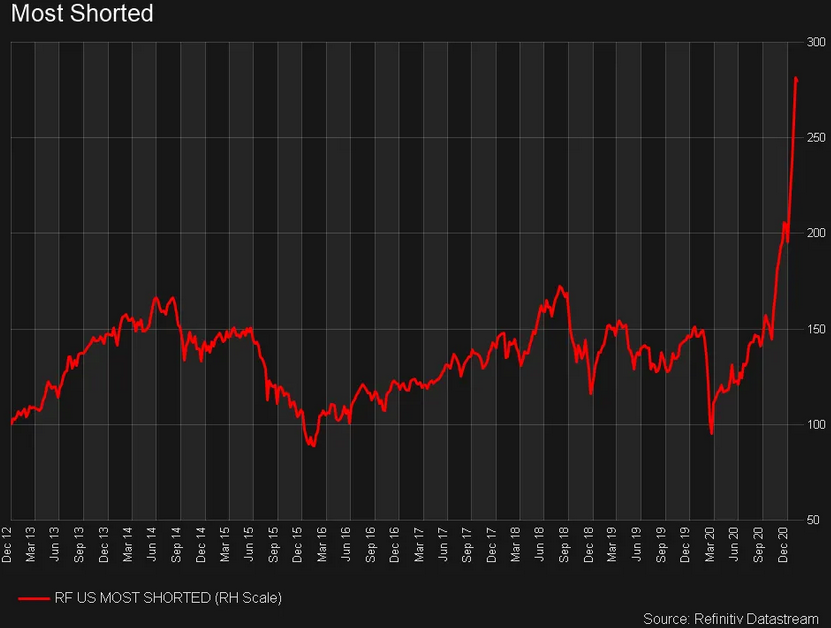
Most Shorted Stocks Chart

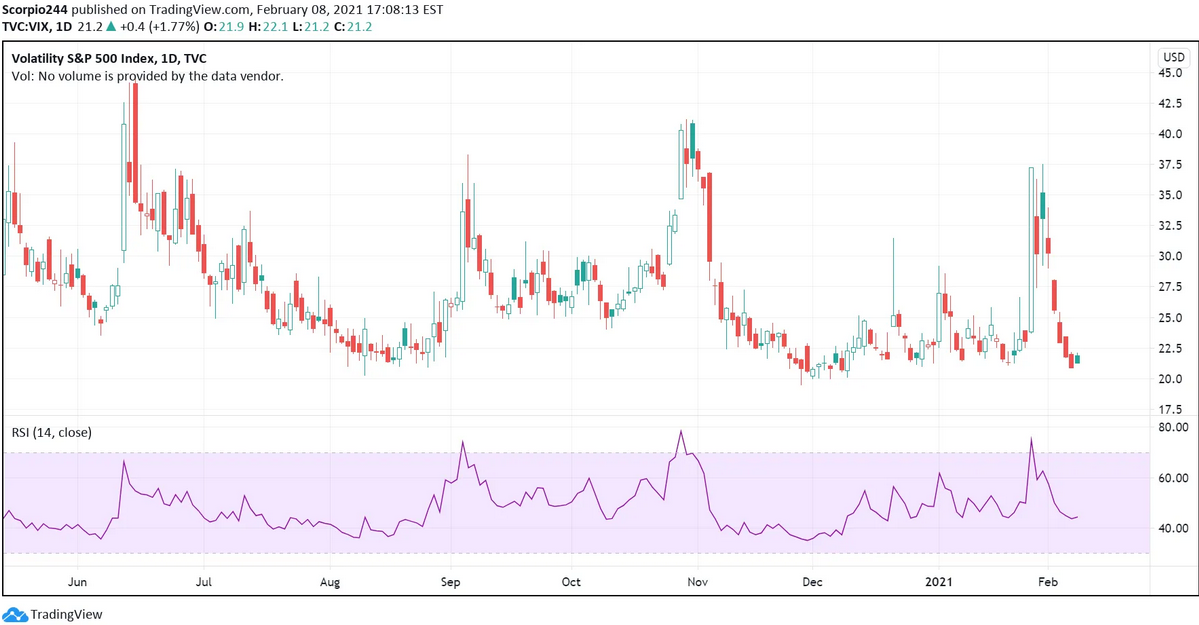
VIX

The VIX was also up yesterday, rising by around 2% to finish at 21.2. Again, one of the warning signs I like to track—rising volatility and rising stock prices—typically an indication of a market that is overheating as market makers jack up the pricing on options.
VIX Daily Chart

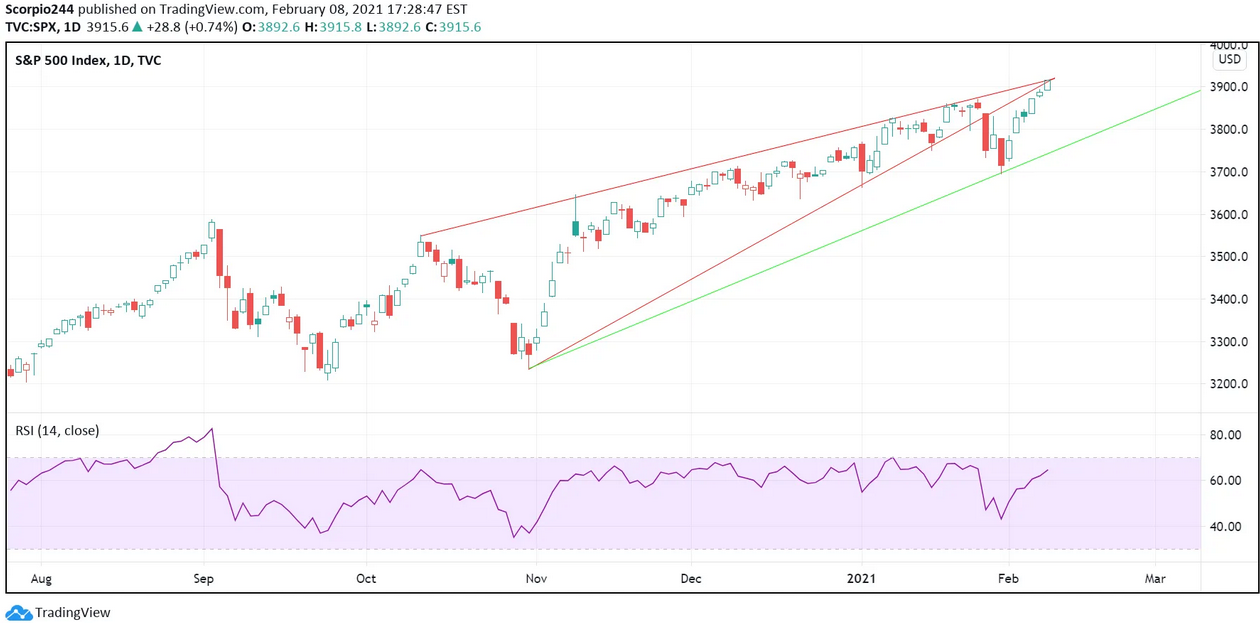
This, for now, remains the name of the market game, because if this is indeed the bottom of the range for the VIX, which I believe it is, and implied volatility starts to rise again, then the S&P 500 should be ready to take another dip lower. Whether it is of the 3-5% variety as we saw 2 weeks ago, or something more, I can’t tell right now.

The technical chart would suggest that 3,780 is the next spot on the S&P 500 we will soon see.
3rd party Ad. Not an offer or recommendation by Investing.com. See disclosure here or remove ads .

S&P 500 Index Daily Chart

Square

Square (NYSE:SQ) broke out on Monday, rising above $250. The stock is likely to rise slightly more, perhaps to around $280, and the top trend line.
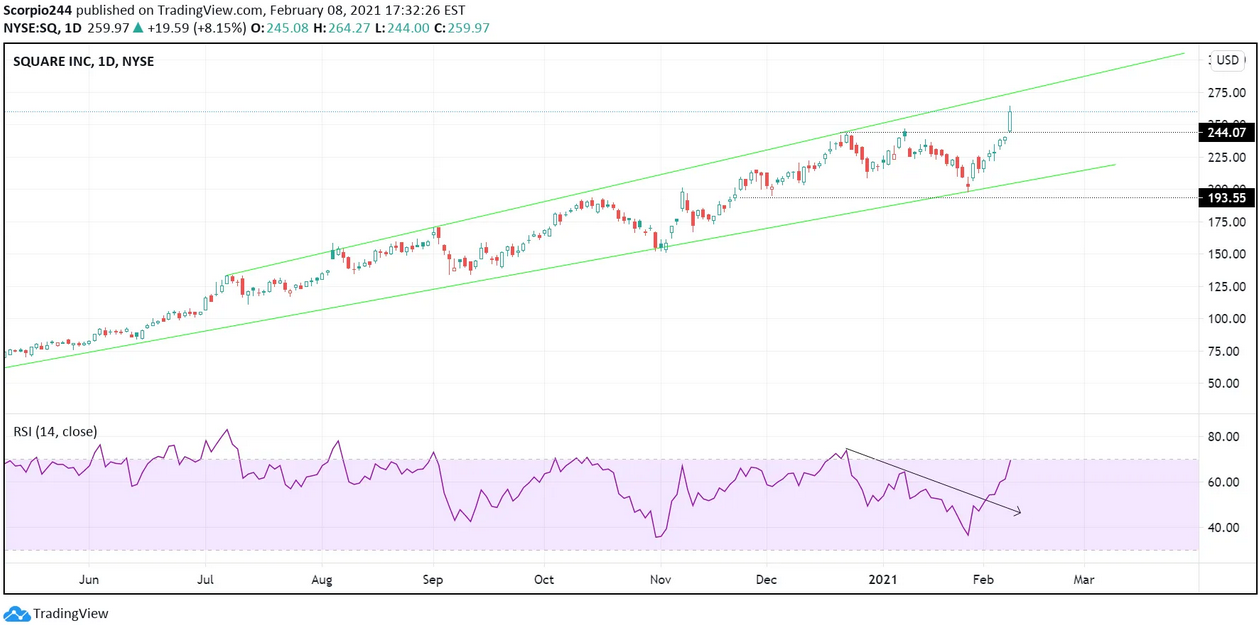
Square Inc Daily Chart

Lemonade

Lemonade (NYSE:LMND) is just flirting right now with a potential break of support at $140. If it t should fall below that support level, it'll most likely quickly return to around $120.
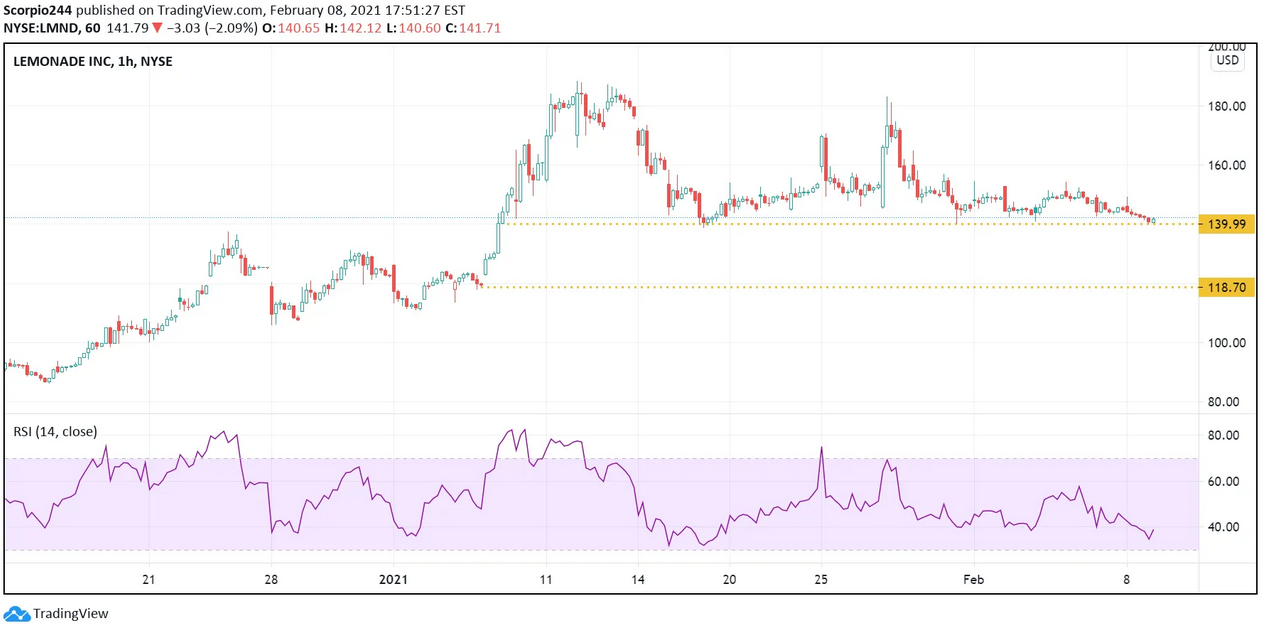
Lemonade Inc 1-Hr Chart

Exxon

Oil probably has a couple of more bucks to rise, which will probably be good news for Exxon (NYSE:XOM). The stock broke free of resistance on Monday around $51, and that will probably give it some more room to rise, perhaps to around $54.
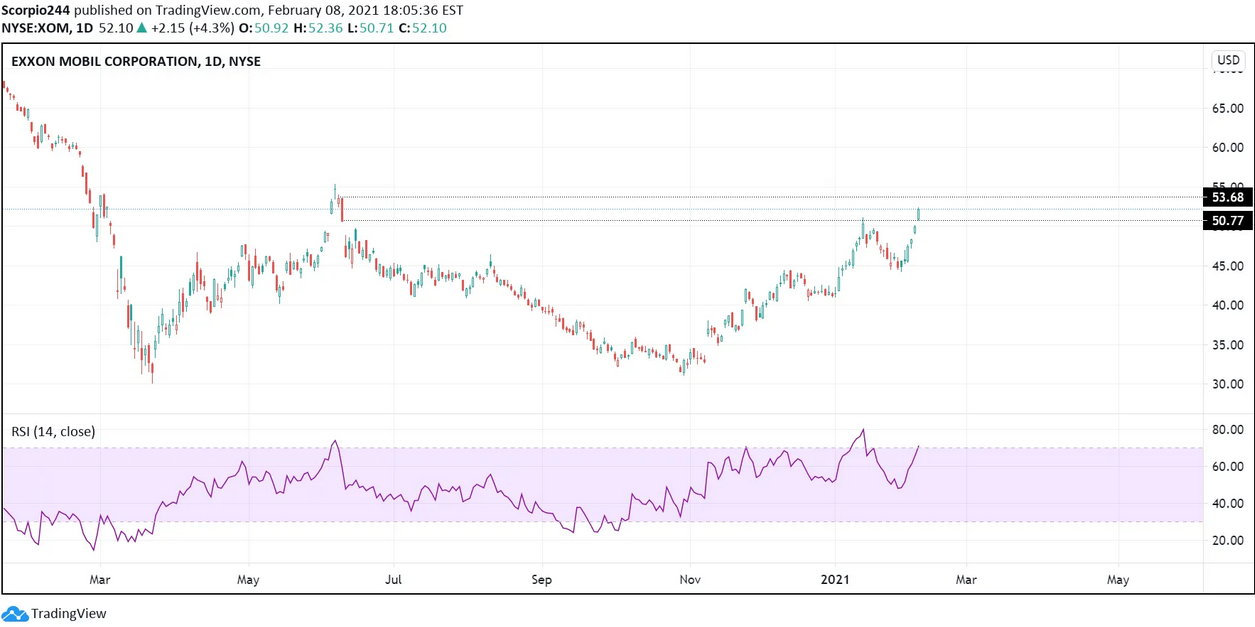
Exxon Mobil Corp Daily Chart

I don’t know, that’s all I have.

Original Post

Latest comments

I give it one more week after some big earnings come out, then see a cool down from these all time highs.
This article is garbage. VIX rising with stocks doesn’t mean a market is overheating. It means one side is right and one side is wrong (since they shouldn’t move in parallel) and to wait to see which way they split as confirmation where the trend will go. S&P ripped up and VIX dropped hard. The confirmation is in. S&P will continue higher and VIX will continue lower. There is a gap on VIX down to $17 that’s been there for an entire year now and they are going to crush the VIX to fill it with all likelihood. As that happens we will melt up to $4000
Do you always write about gloom & doom ?
Risk Disclosure: Trading in financial instruments and/or cryptocurrencies involves high risks including the risk of losing some, or all, of your investment amount, and may not be suitable for all investors. Prices of cryptocurrencies are extremely volatile and may be affected by external factors such as financial, regulatory or political events. Trading on margin increases the financial risks.
Before deciding to trade in financial instrument or cryptocurrencies you should be fully informed of the risks and costs associated with trading the financial markets, carefully consider your investment objectives, level of experience, and risk appetite, and seek professional advice where needed.
Fusion Media would like to remind you that the data contained in this website is not necessarily real-time nor accurate. The data and prices on the website are not necessarily provided by any market or exchange, but may be provided by market makers, and so prices may not be accurate and may differ from the actual price at any given market, meaning prices are indicative and not appropriate for trading purposes. Fusion Media and any provider of the data contained in this website will not accept liability for any loss or damage as a result of your trading, or your reliance on the information contained within this website.
It is prohibited to use, store, reproduce, display, modify, transmit or distribute the data contained in this website without the explicit prior written permission of Fusion Media and/or the data provider. All intellectual property rights are reserved by the providers and/or the exchange providing the data contained in this website.
Fusion Media may be compensated by the advertisers that appear on the website, based on your interaction with the advertisements or advertisers.
© 2007-2024 - Fusion Media Limited. All Rights Reserved.