Get 40% Off
💰 Buffett reveals a $6.7B stake in Chubb. Copy the full portfolio for FREE with InvestingPro’s Stock Ideas toolCopy Portfolio

Stocks Rise Again, Moving Further Into Over Extended Territory

Published 08/30/2020, 12:45 AM
Updated 09/20/2023, 06:34 AM
US500
-
AAPL
-
MA
-
V
-
TSLA
-
XBI
-
HGX
-
PYPL
-
SQ
-

Stocks increased yet again, and are pushing the boundaries here in terms of how overbought they are going to get. The S&P 500 surged to 3,508 and an RSI over 79. If we keep climbing, the next level of resistance comes at 3,527. To say the market will keep rising seems like complete lunacy, but that what it does. The Fed hasn’t increased its balance sheets in weeks; there is still no relief bill insight. So, not sure here what derails things at this point. Apple (NASDAQ:AAPL) and Tesla (NASDAQ:TSLA) will both split their shares on Monday, so perhaps that will shift the tied? Not sure.

I, for one, would not be chasing the market up here, but I haven’t been fond of this market the entire time. I have been a happy holder of the stocks I own, and the cash levels I have carried. Luckily, for me, I have owned the right stocks.
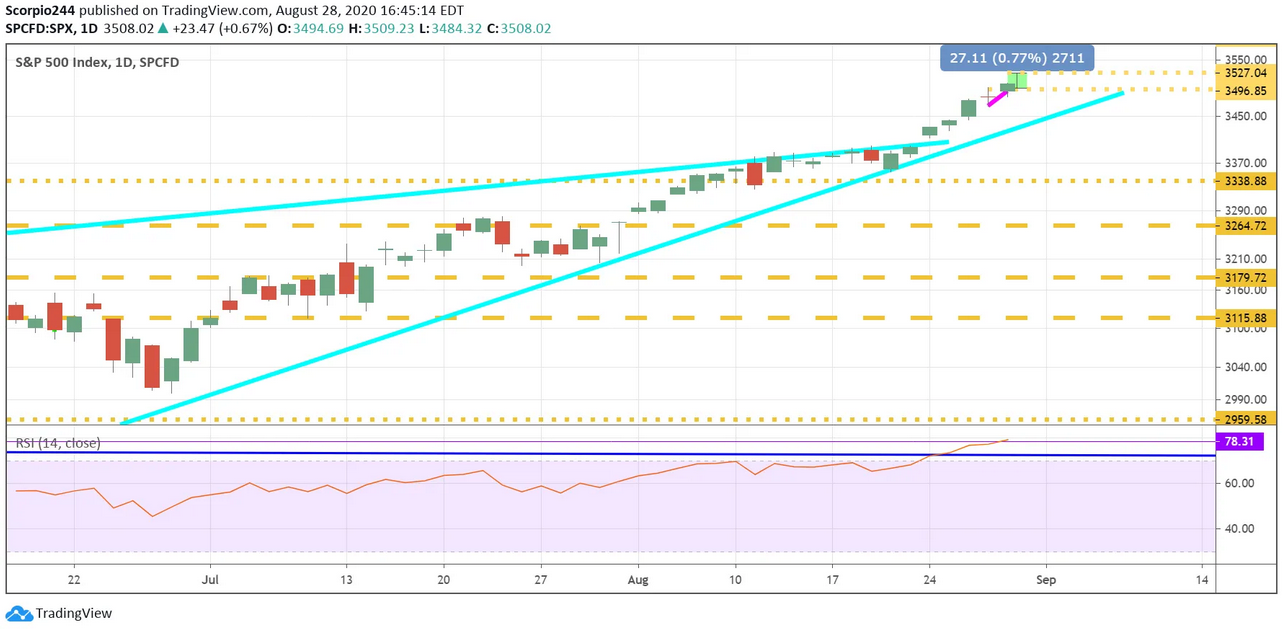
S&P 500 Daily Chart

You can tell, algo’s/traders whatever you want to call them, are just rotating around at this point, looking catch-up trades. I complained for weeks about how Square (NYSE:SQ) and PayPal (NASDAQ:PYPL) were rising, and how Visa (NYSE:V) and Mastercard (NYSE:MA) were not participating. Well, that suddenly shifted, with PayPal and Square going nowhere and Visa and Mastercard surging. V and MA have a lot of ground to catch up on, but it seems like that is the trade that is taking place. I’m certainly not going to complain.
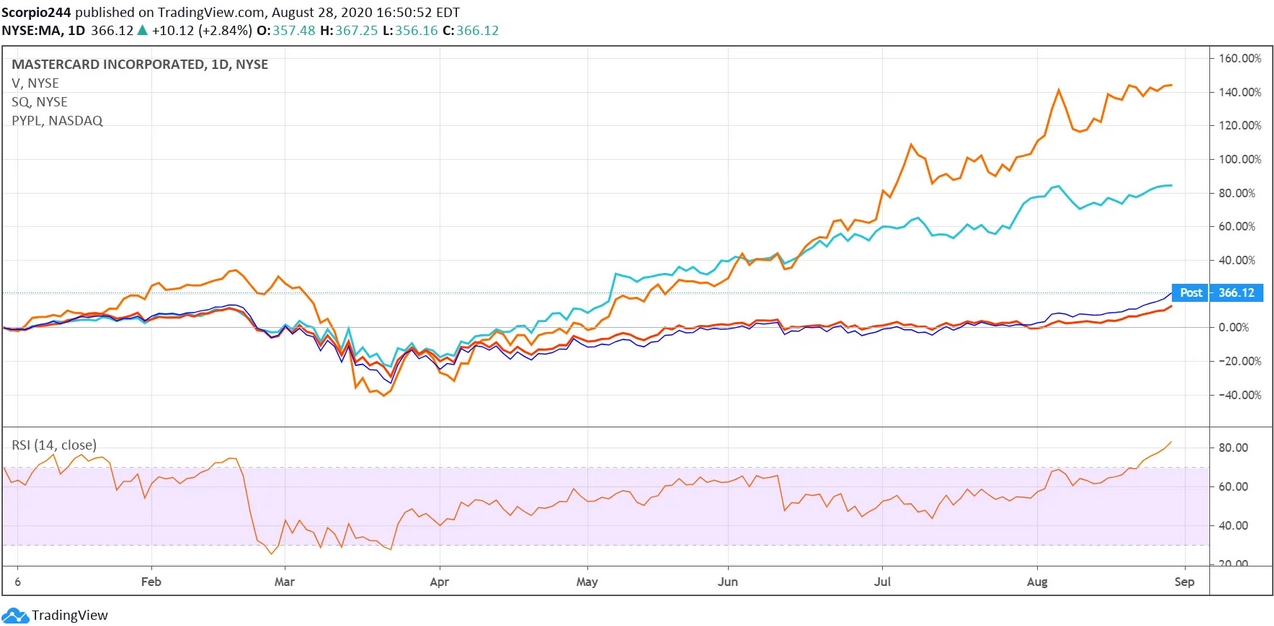
MasterCard Daily Chart

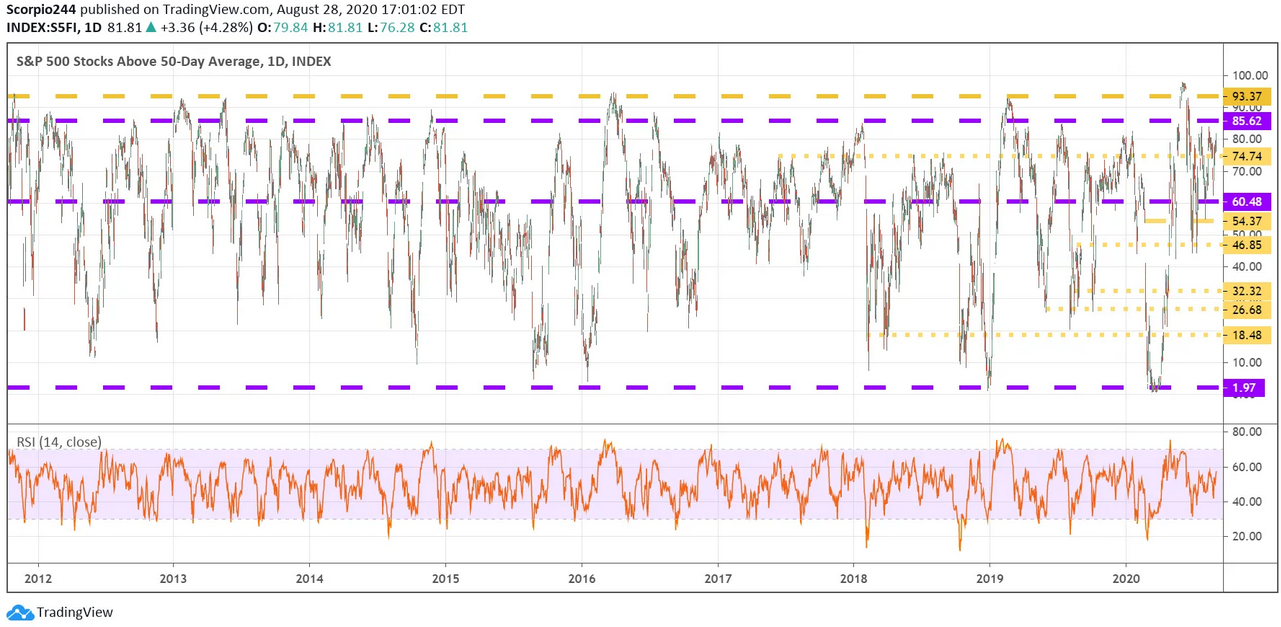
Noteworthy, in just one week, we went from the number of stocks in the S&P 500 above their 50-day moving average from 64.8% to 81%. Why is this amazing, because since 2012, the 85% region tends to the upper end of the range. Basically, from a near breakdown level to near overbought levels in a week.
3rd party Ad. Not an offer or recommendation by Investing.com. See disclosure here or remove ads .

S&P 500 Stocks Above 50 Day Avg Daily Chart

Housing Sector

Keep an eye on the HGX, remember it told us the Fall of 2018 crash was coming. Nothing to worry about yet.
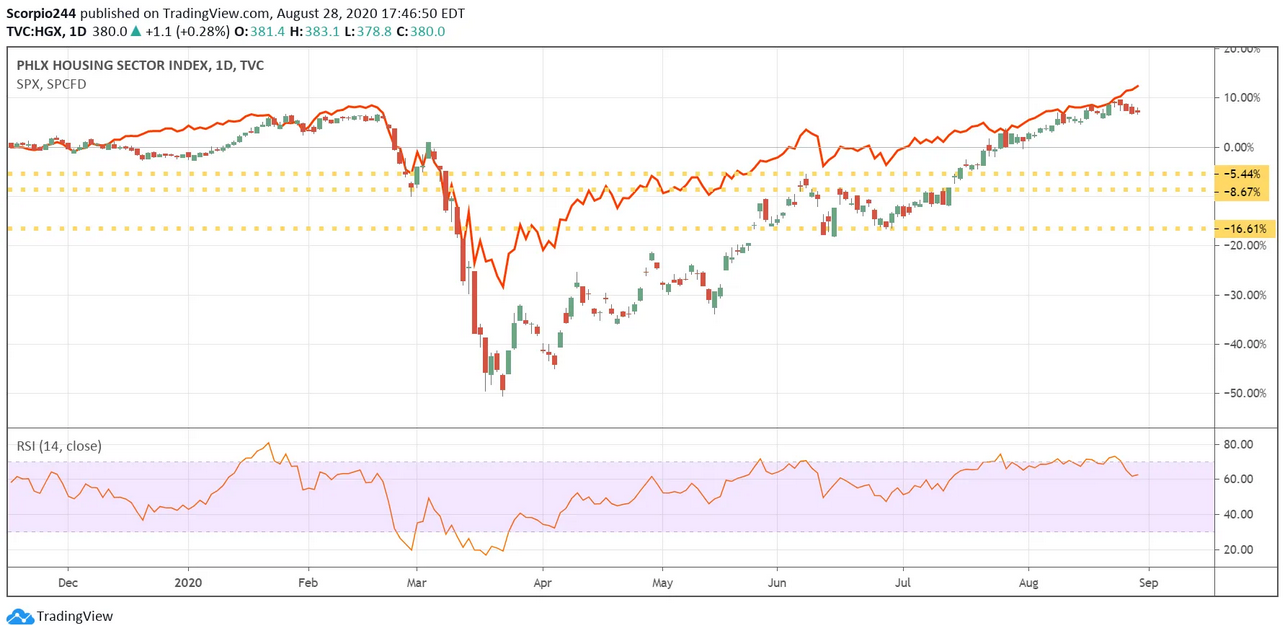
HGX Chart

Biotech

Maybe vaccine fever has pasted, but the SPDR® S&P Biotech ETF (NYSE:XBI) hasn’t been a strong performer since July 20.
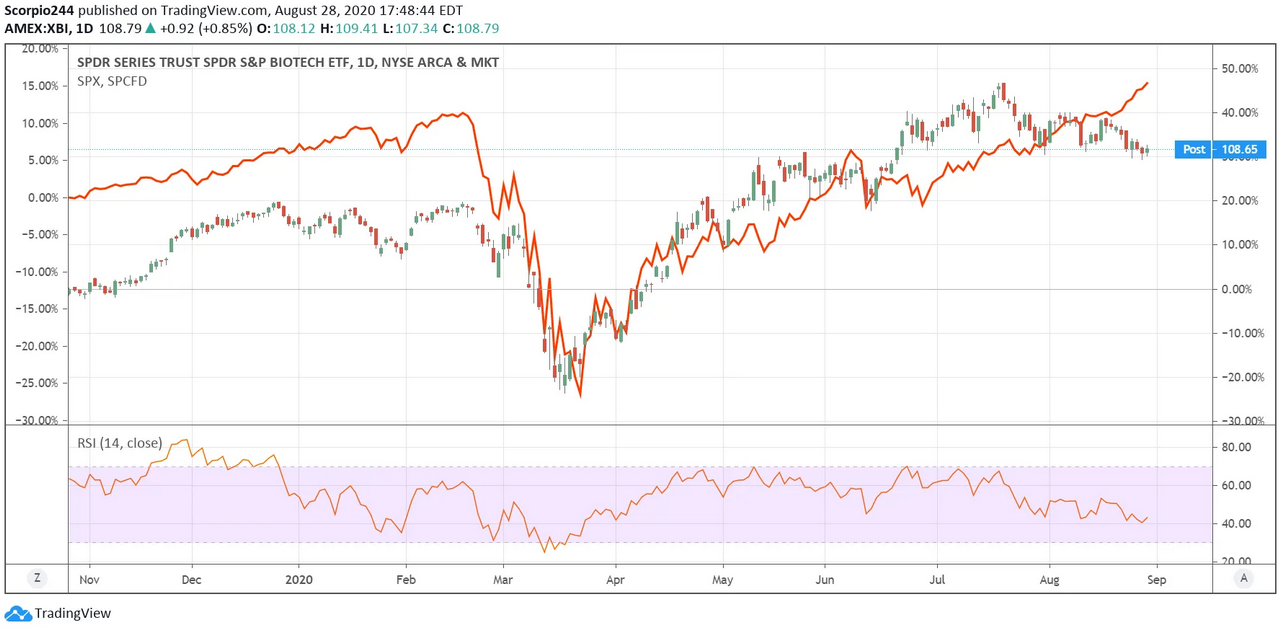
XBI Daily Chart

Original Post

Latest comments

Risk Disclosure: Trading in financial instruments and/or cryptocurrencies involves high risks including the risk of losing some, or all, of your investment amount, and may not be suitable for all investors. Prices of cryptocurrencies are extremely volatile and may be affected by external factors such as financial, regulatory or political events. Trading on margin increases the financial risks.
Before deciding to trade in financial instrument or cryptocurrencies you should be fully informed of the risks and costs associated with trading the financial markets, carefully consider your investment objectives, level of experience, and risk appetite, and seek professional advice where needed.
Fusion Media would like to remind you that the data contained in this website is not necessarily real-time nor accurate. The data and prices on the website are not necessarily provided by any market or exchange, but may be provided by market makers, and so prices may not be accurate and may differ from the actual price at any given market, meaning prices are indicative and not appropriate for trading purposes. Fusion Media and any provider of the data contained in this website will not accept liability for any loss or damage as a result of your trading, or your reliance on the information contained within this website.
It is prohibited to use, store, reproduce, display, modify, transmit or distribute the data contained in this website without the explicit prior written permission of Fusion Media and/or the data provider. All intellectual property rights are reserved by the providers and/or the exchange providing the data contained in this website.
Fusion Media may be compensated by the advertisers that appear on the website, based on your interaction with the advertisements or advertisers.
© 2007-2024 - Fusion Media Limited. All Rights Reserved.