Get 40% Off
🚨 Volatile Markets? Find Hidden Gems for Serious Outperformance
Find Stocks Now

Stocks Jump To All-Time Highs As Prospect For Fed Rate Cut Rise

Published 02/06/2020, 03:55 AM
Updated 09/20/2023, 06:34 AM

S&P 500 (SPY)

Stocks rose sharply on February 5 by over 1.1% to close at 3,334, finishing just below the old all-time highs around 3,337. The question on everyone’s mind, do we move higher, or do we move lower to fill the gap down at 3,300. It seems very difficult to decide, that is for sure, but it really would not surprise me to see the S&P 500 reverse lower to fill that gap. After all, there two giant gaps that needed to be filled, so filling at least one seems reasonable.

The ISM non-manufacturing report came in much better than expected at 55.5 versus a consensus of 55.2. More importantly, it corresponds to a 2.4% GDP growth in the first quarter. Additionally, we also got the ADP jobs data, which was significantly better than expected at 291,000 versus estimates of 154,000. It leaves the BLS jobs report for us to ponder on Friday morning.
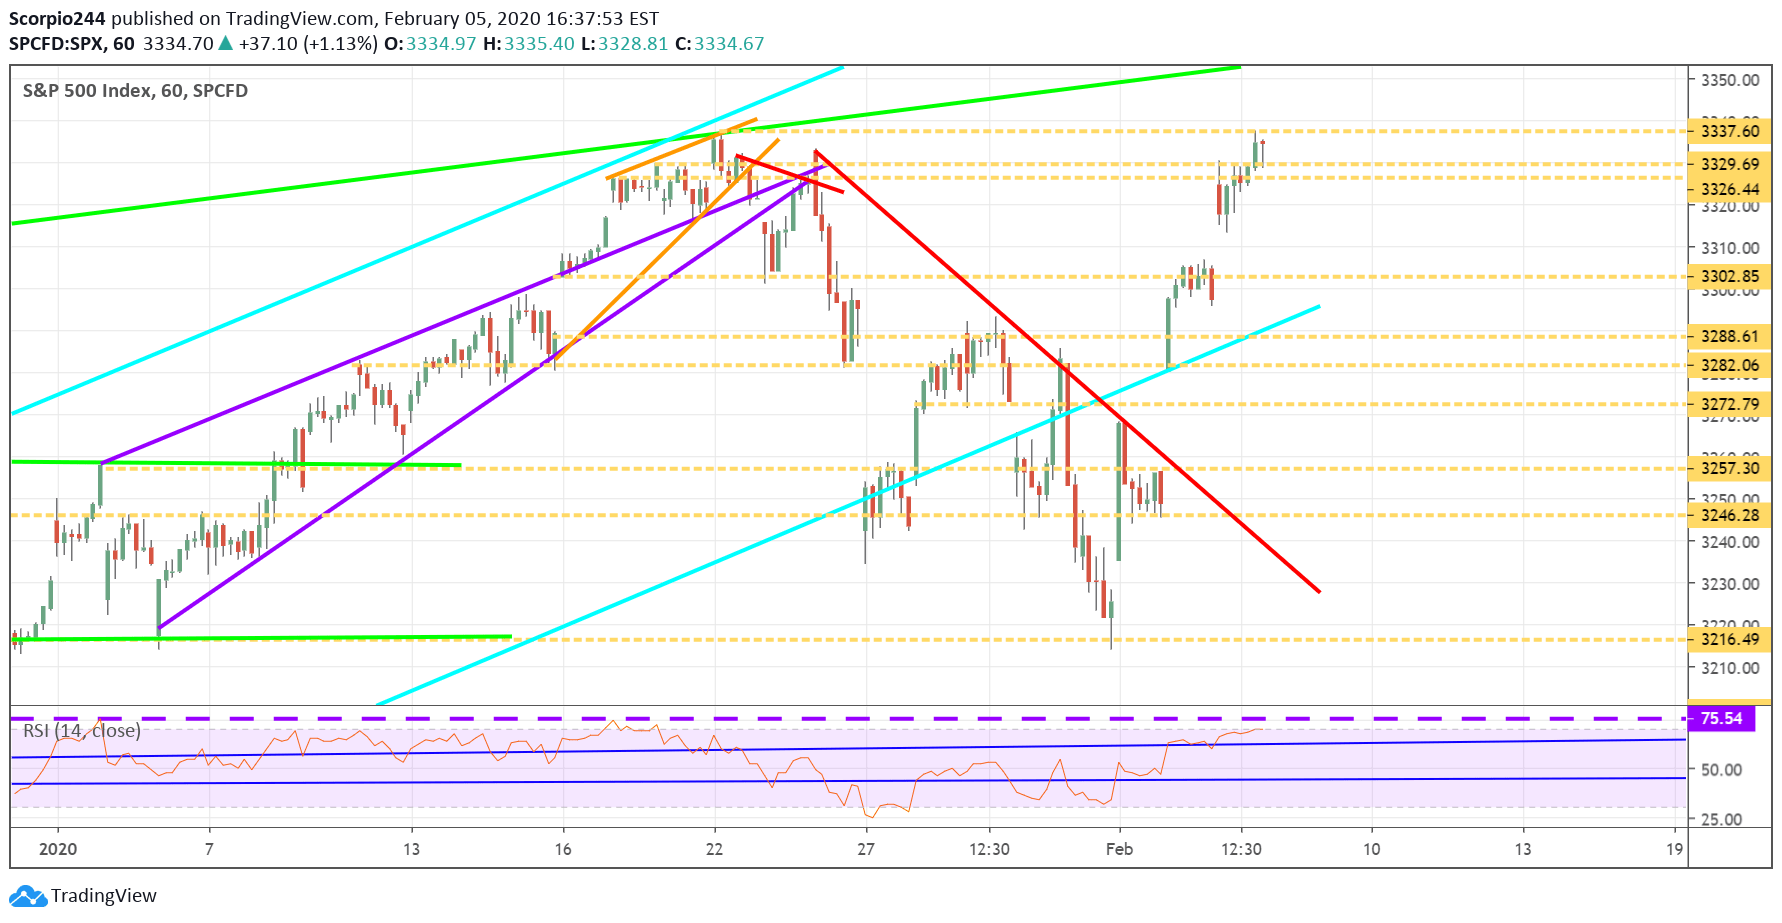
S&P 500 Index Chart

But more interestingly is that the market appears to be pricing in another rate cut, despite the surprisingly healthy economy. You can see how the current fed funds futures deviate from the prospects for July and September.
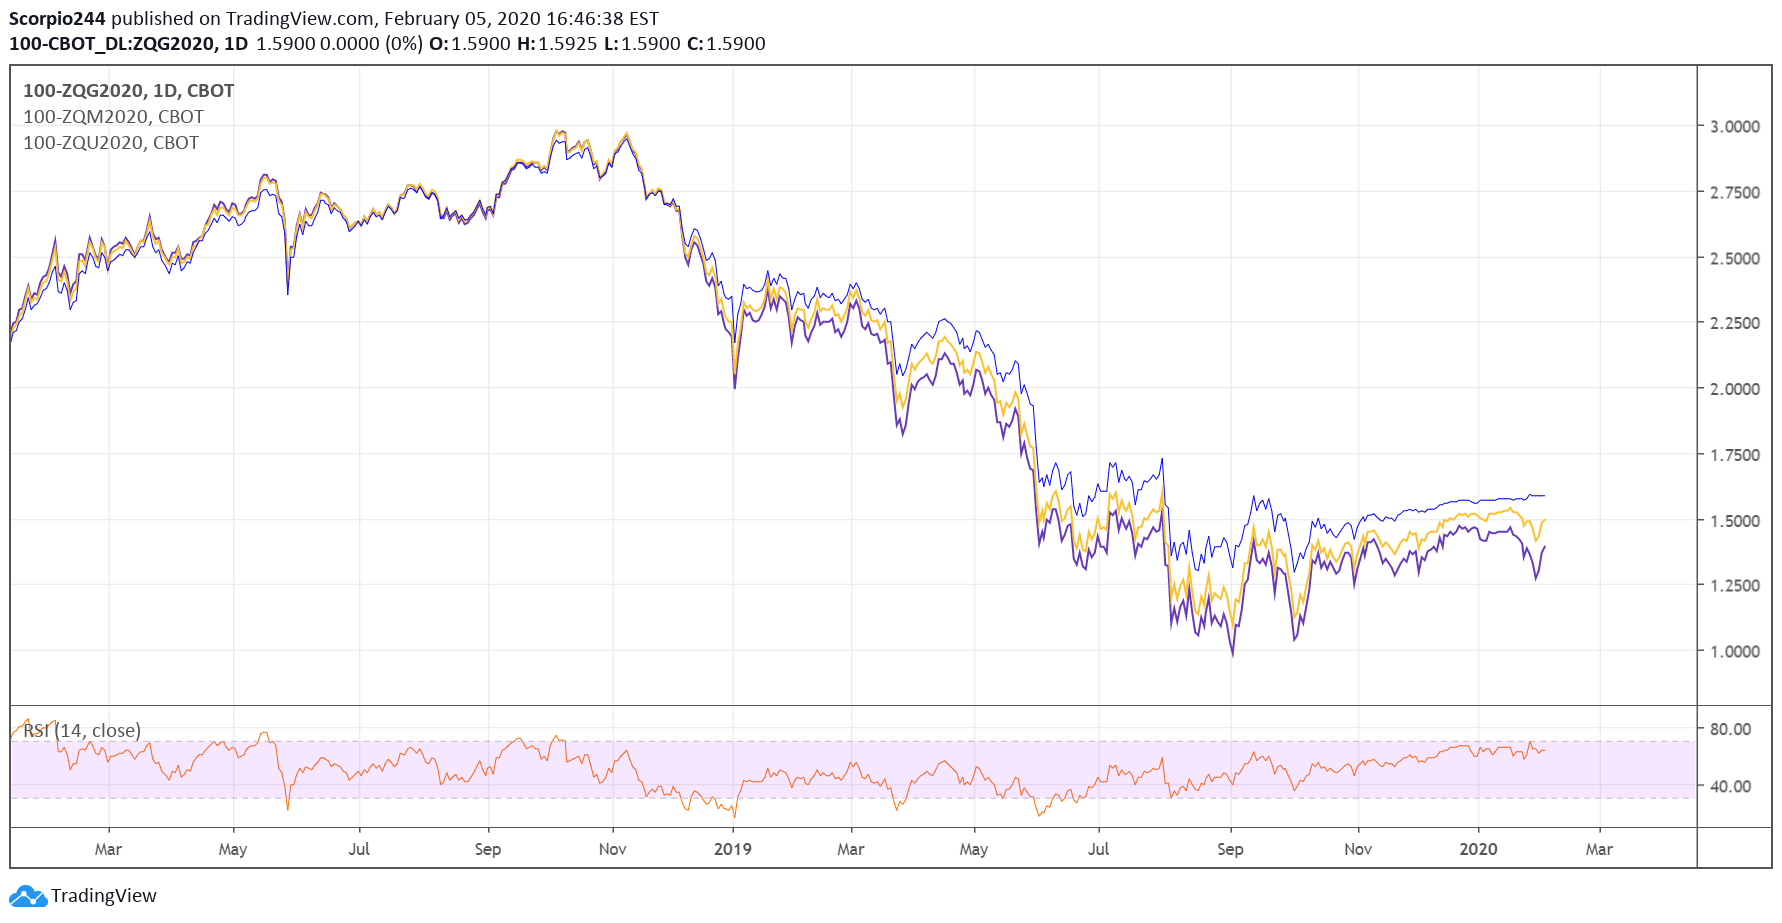
100-CBOT Daily Chart

Disney (DIS)

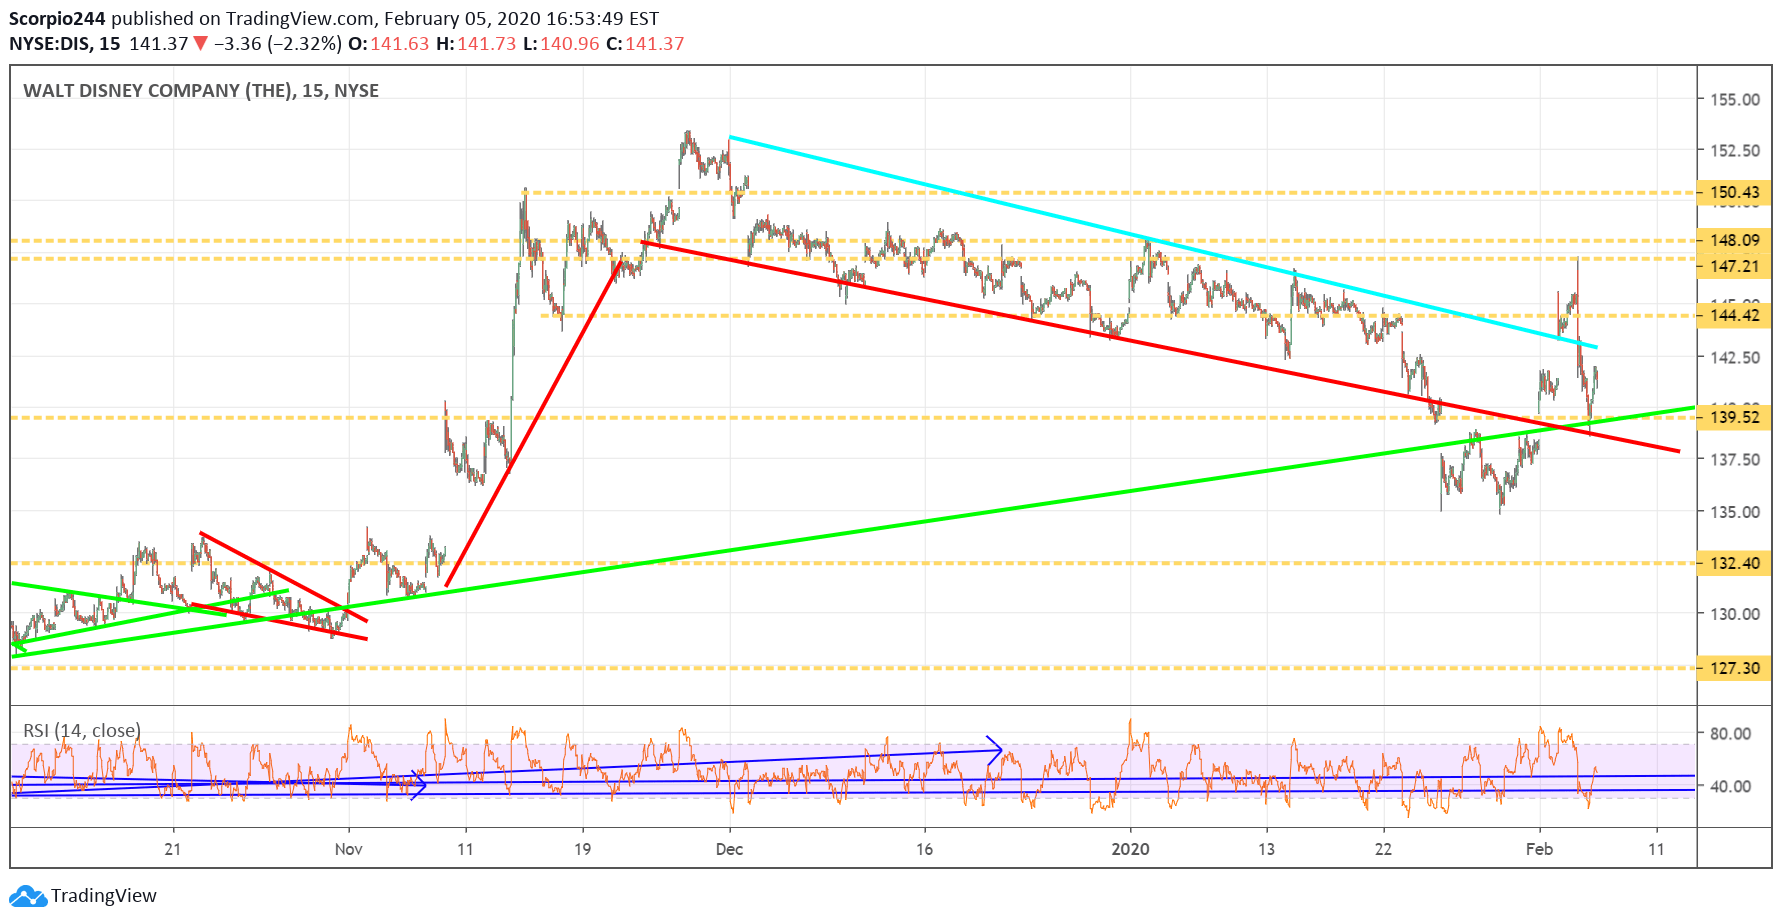
Disney (NYSE:DIS) fell yesterday, which I’m having a tough time understanding because the numbers the company reported on the streaming seemed to be very strong. The market appears to be discounting that — suggesting that the sharp rise in subscribers will not last, or that the surge in subscribers has already been priced in. We will need to watch how the stock trades going to forward to find our answer.
3rd party Ad. Not an offer or recommendation by Investing.com. See disclosure here or remove ads .
Walt Disney Chart

Boeing (BA)

Boeing (NYSE:BA) did well yesterday, rising above the downtrend we have been tracking. It likely indicates the stock increases to around $340. Even the RSI looks a little bit better.
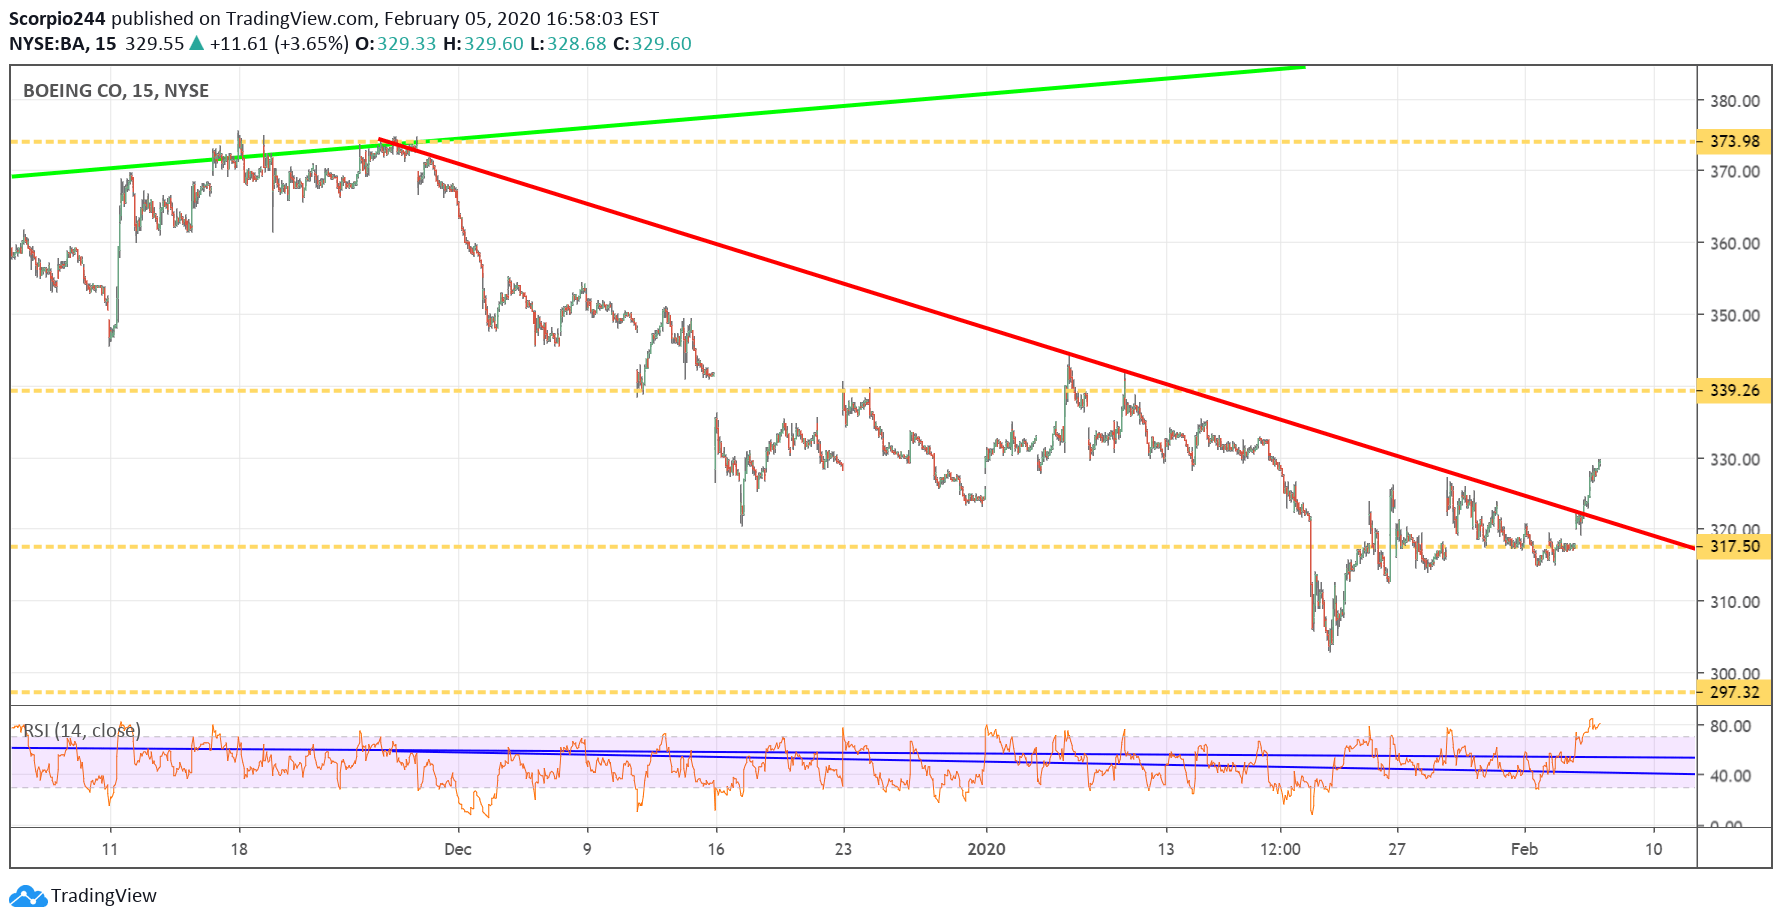
Boeing Chart

Roku (ROKU)

Well, if Disney’s subscriber results weren’t good enough to lift the Disney, then they most certainly weren’t good enough to lift Roku's (NASDAQ:ROKU), and that is what happened. The stock fell yesterday and still has all the markings of a stock heading lower.
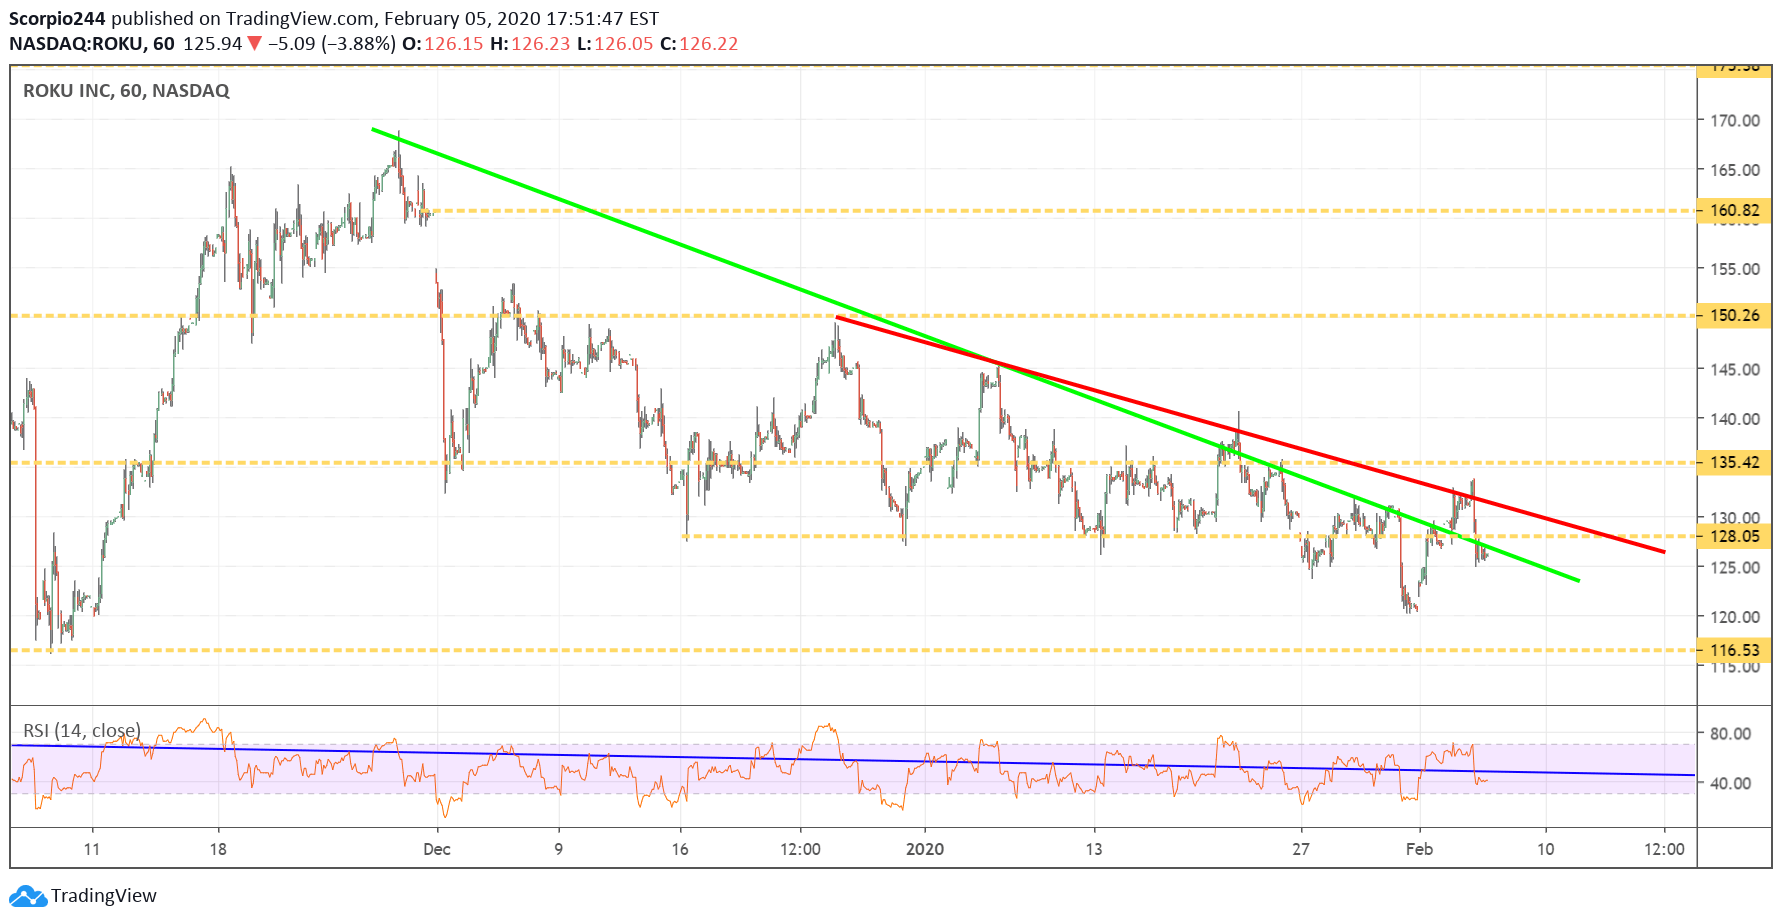
Roku Chart

Skyworks (SWKS)

Skyworks (NASDAQ:SWKS) has managed to hold support, and as long as it doesn’t get caught up in any negative China-related headlines, I think this one should be ok. The stock managed to hold key support levels at $112.50. Remember it was last week we saw some betting shares would rally.
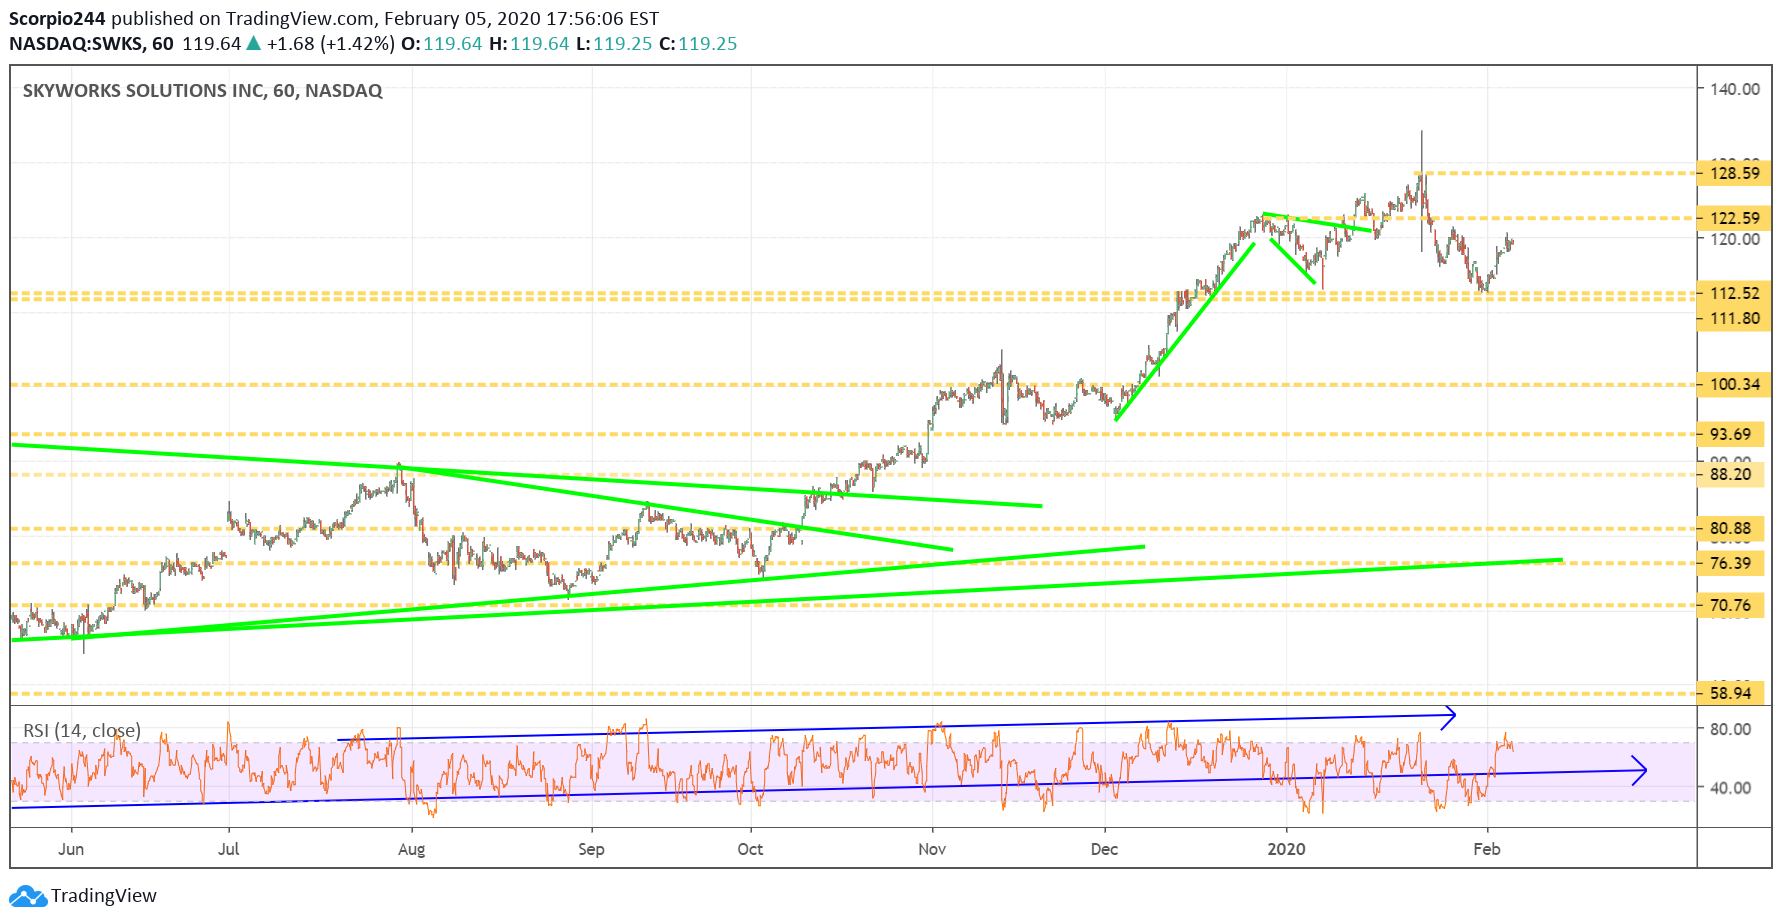
Skyworks Chart

Acadia (ACAD)

Perhaps my eyes are deceiving me, but is ACADIA (NASDAQ:ACAD) breaking out of a falling wedge? It sure looks like it. Clear, $43.50, and I think we start to see some upside price action. Maybe, they will even report fourth quarter results before the first quarter ends.
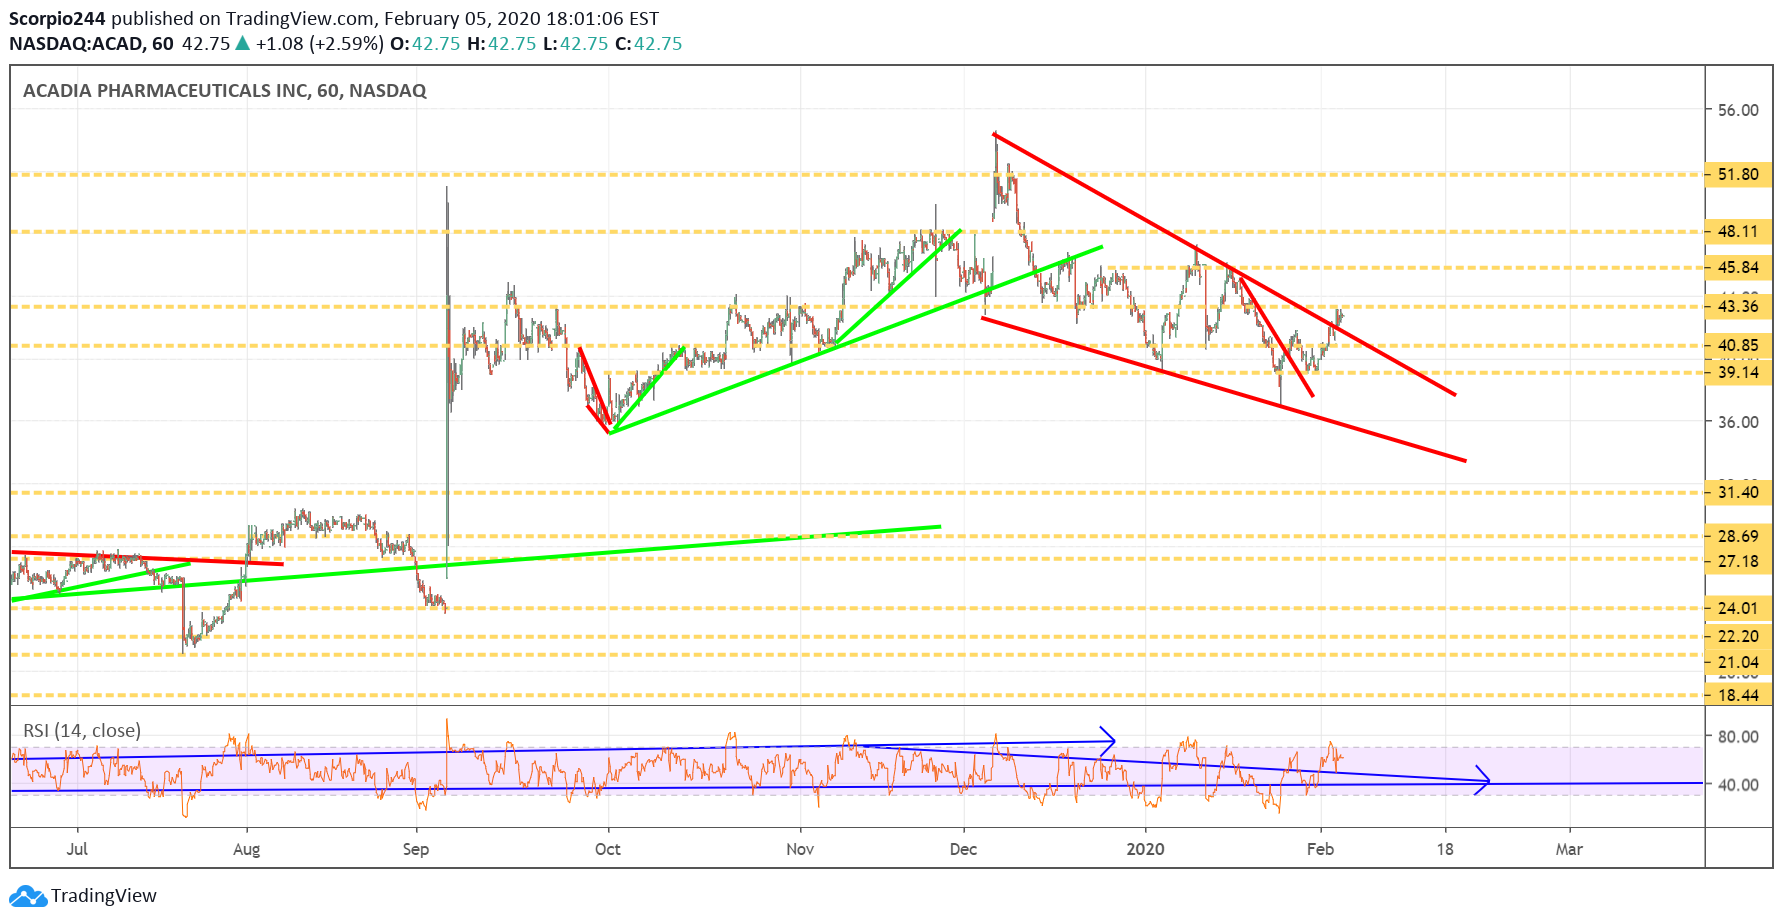
Acadia Inc Chart

Original Post

Latest comments

serious insult to injury: there should not be more financial stimulation beyond stuffing Wall street trading houses with 1.2 Trillion dollar repo loans (a portion of which will fall through the cracks and will never be repaid). --- Trump is plundering today for his selfish tomorrow. -- future generations have to carry the burden of financial irresponsibility by the fed
thanks
Risk Disclosure: Trading in financial instruments and/or cryptocurrencies involves high risks including the risk of losing some, or all, of your investment amount, and may not be suitable for all investors. Prices of cryptocurrencies are extremely volatile and may be affected by external factors such as financial, regulatory or political events. Trading on margin increases the financial risks.
Before deciding to trade in financial instrument or cryptocurrencies you should be fully informed of the risks and costs associated with trading the financial markets, carefully consider your investment objectives, level of experience, and risk appetite, and seek professional advice where needed.
Fusion Media would like to remind you that the data contained in this website is not necessarily real-time nor accurate. The data and prices on the website are not necessarily provided by any market or exchange, but may be provided by market makers, and so prices may not be accurate and may differ from the actual price at any given market, meaning prices are indicative and not appropriate for trading purposes. Fusion Media and any provider of the data contained in this website will not accept liability for any loss or damage as a result of your trading, or your reliance on the information contained within this website.
It is prohibited to use, store, reproduce, display, modify, transmit or distribute the data contained in this website without the explicit prior written permission of Fusion Media and/or the data provider. All intellectual property rights are reserved by the providers and/or the exchange providing the data contained in this website.
Fusion Media may be compensated by the advertisers that appear on the website, based on your interaction with the advertisements or advertisers.
© 2007-2024 - Fusion Media Limited. All Rights Reserved.