S&P 500
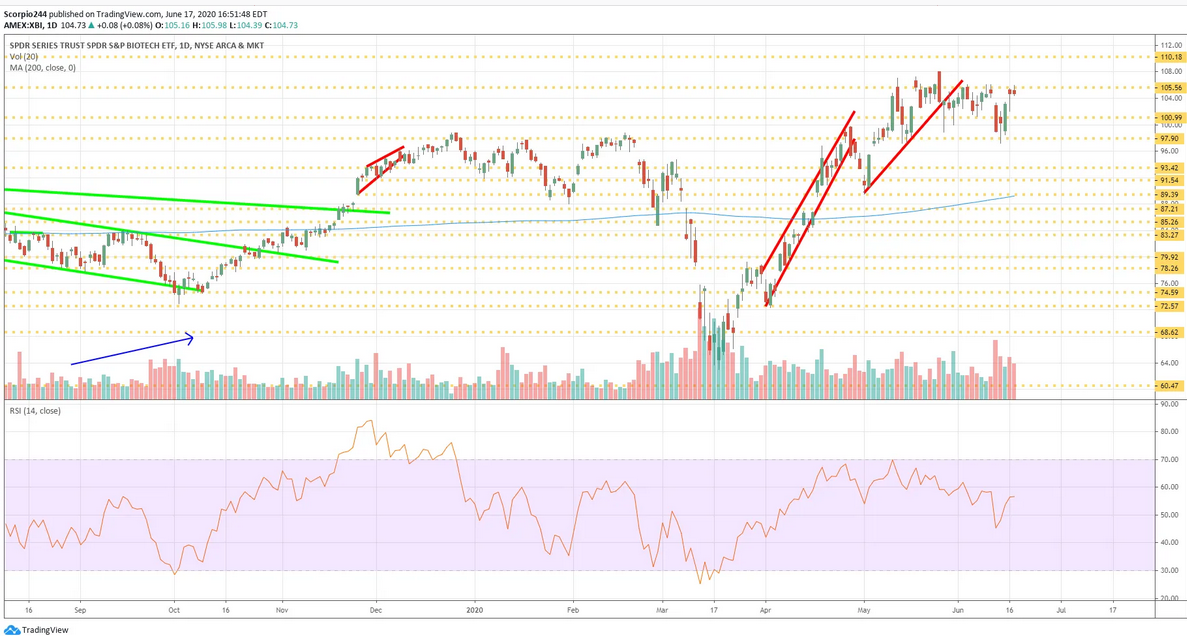
It turned out to be a pretty wild day, not all that different then what I expected. The S&P 500 index finished the day nearly 90 basis points off its highs, to close the day down by 36 basis points. Something is going on at the 3140 level in the S&P 500, which is acting as a firm-level of resistance during the last two days. Perhaps it has something to do with options expiration on Friday, but it seems the buyers tried mightly to break that level a handful of times and have been unsuccessful. By the day’s end, it just seemed like the buyers were outnumbered and overwhelmed, and the market drifted lower.
Volume levels in the SPY have been drifting lower since Tuesday morning, a sign that the number of buyers was thinning. Meanwhile, volume accelerated on the late-day decline, suggesting sellers took over. I would not rule out a pullback today to $306 on the SPY.
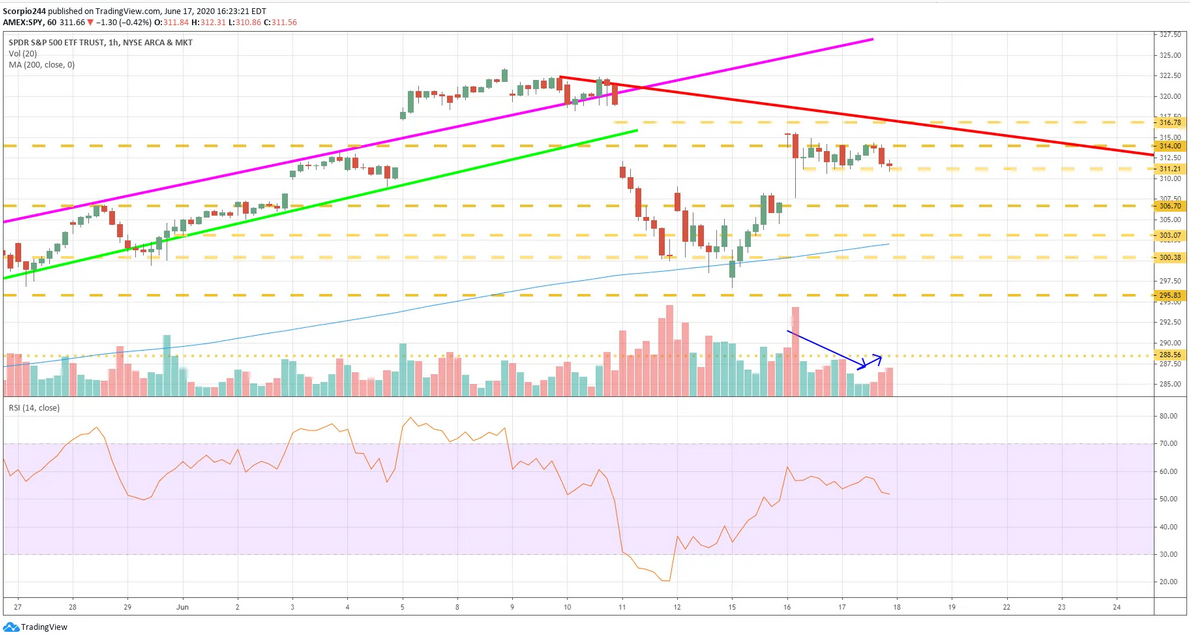
Even the downtrend I pointed yesterday is still enforced, with the SPY failing right at it early yesterday.
(including ext. hours)
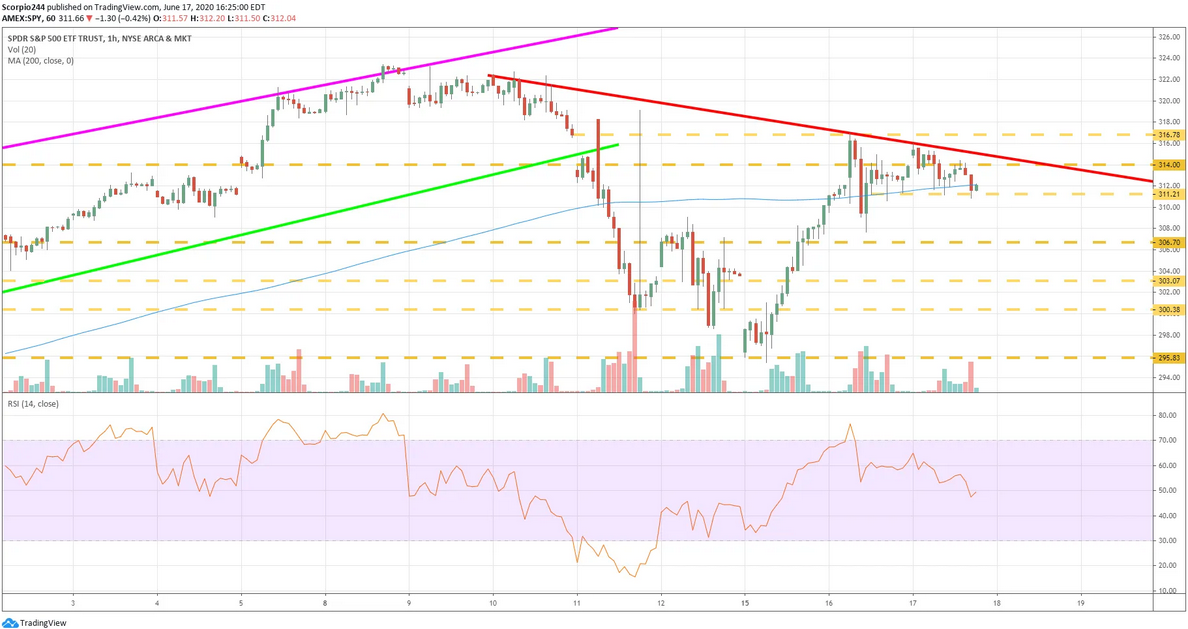
Today will, of course, be, initial and continuing jobless claims. At this point, the continuing claims appear to be the more important number to follow, as it gives a better sense of how many people are returning to work. In the last three weeks, we have been stuck around 21 million. Should claims rise above that level, it would not be viewed as a positive by the markets, as it would suggest that not many people are returning to work. A drop below 20 million would likely be considered to be positive and play into the reopening is going great trade.
Netflix
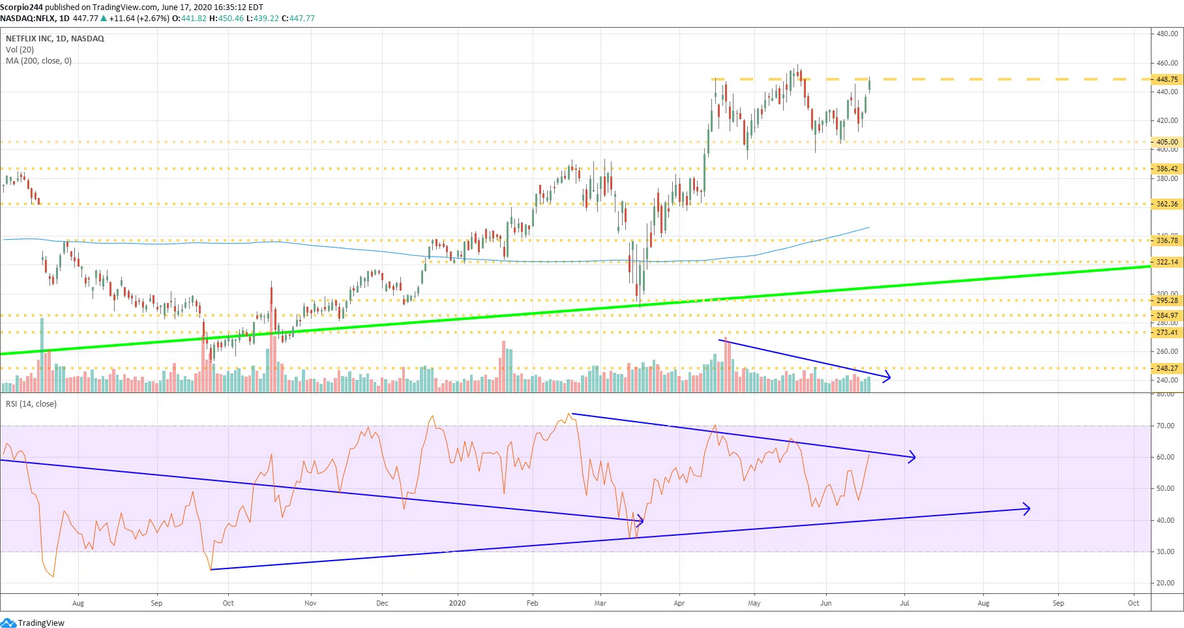
Netflix (NASDAQ:NFLX) has a pattern that looks awfully like a head and shoulders. It also has a declining volume pattern from left to right and an RSI that is trending lower. All a telltale sign of that pattern. So I think this is important for two reasons, one that the stock potentially goes significantly lower. Two, because it seems it is very much a bullish sentiment trade.
Alibaba
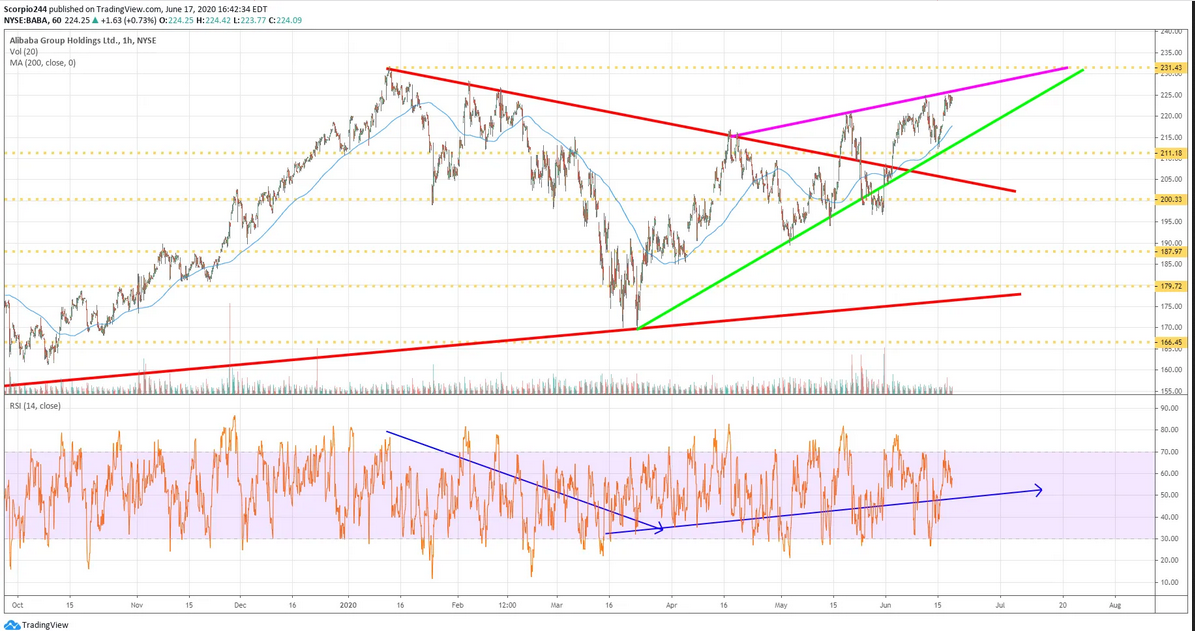
Alibaba (NYSE:BABA) has been steadily trending higher, and I noticed some bullish betting in it this morning. For now, the first level of resistance comes at $232.
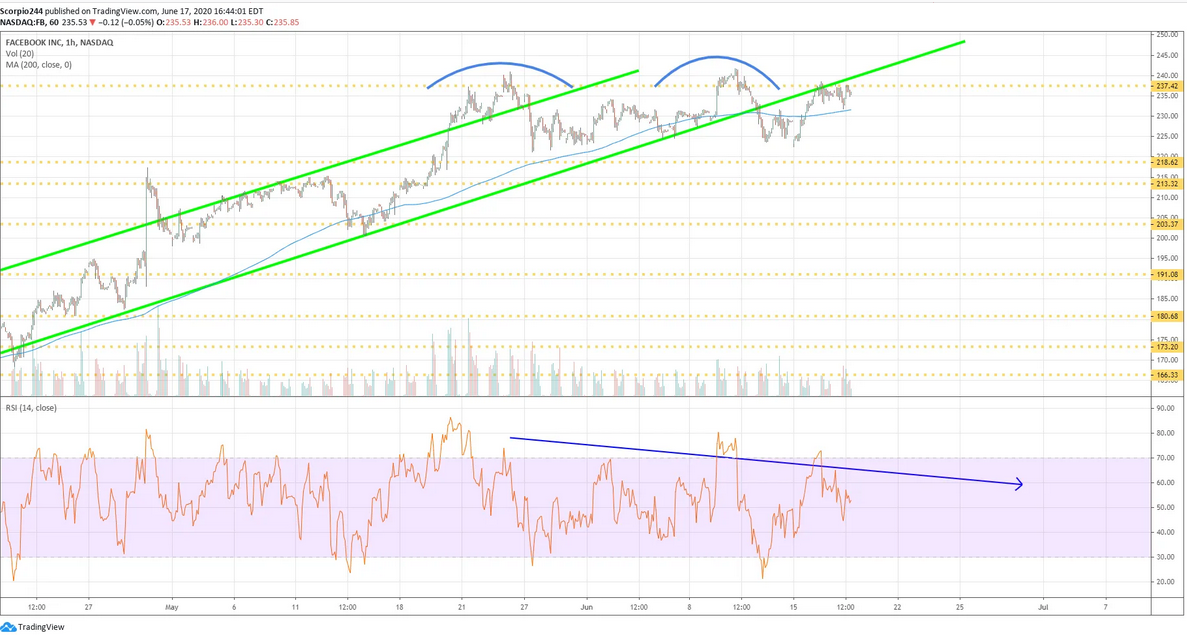
Facebook (NASDAQ:FB) got pinned down at $237.50 yesterday, and as I noted yesterday, I think this one goes lower, potentially back to $203.
Oracle
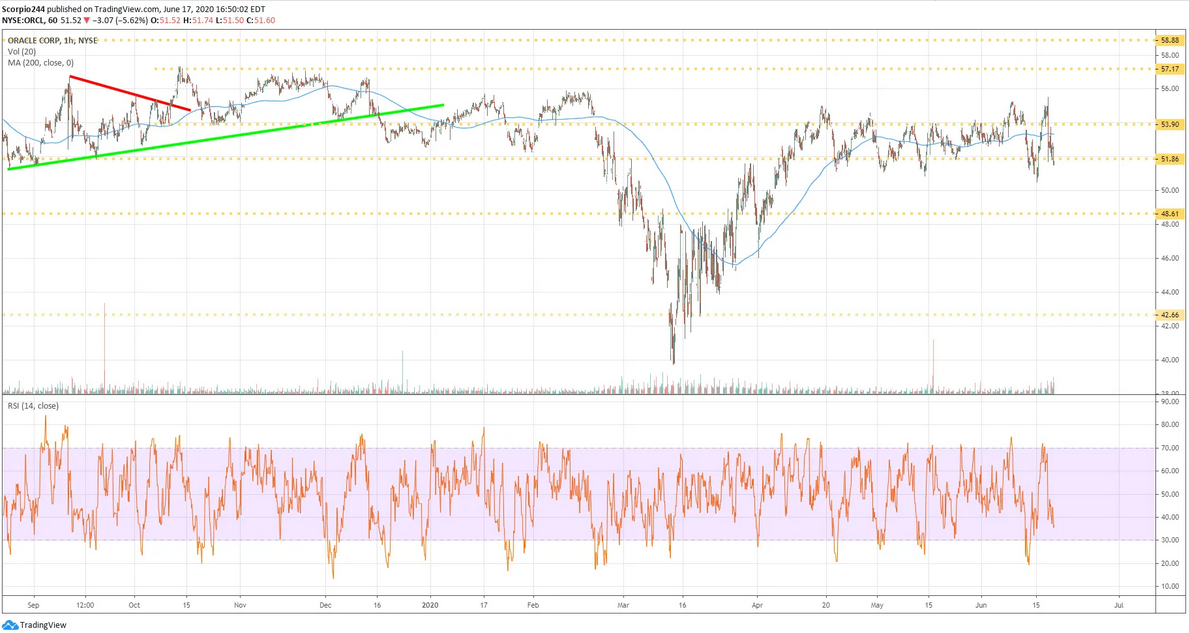
Oracle (NYSE:ORCL) managed to hold on to support in that $51-52 region. That is a significant support level.
Biotech ETF
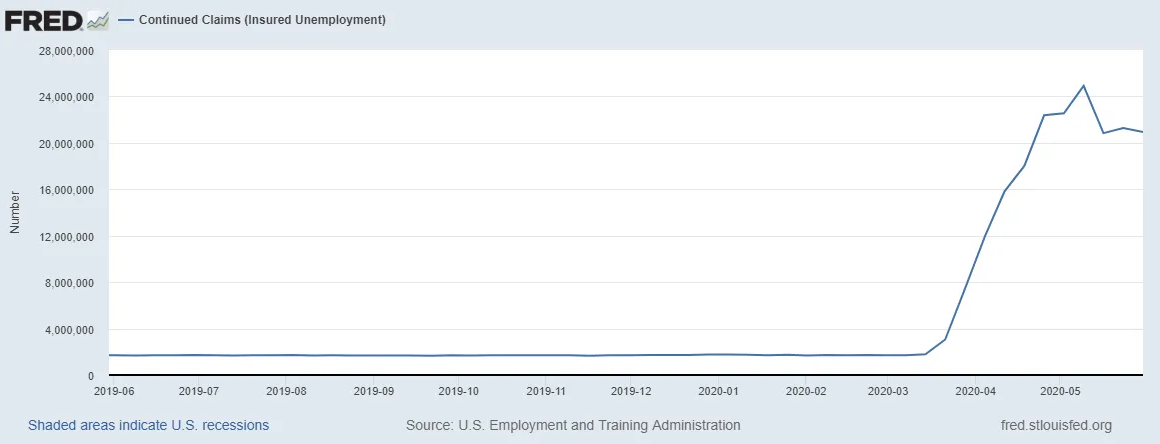
It looks like someone doesn’t want the XBI rising above $105.50. The RSI is trending lower. Therefore a move lower for the ETF may be coming soon. I’d watch that $105.50 level very carefully.
