Whose feeling bullish? Anyone just buying the dip, and sucking it all up? Oh, I’m sure plenty of you are.
It seems at least for the last two days, the market has been in a sell mode and quickly erased all of the gains for the S&P 500 since April 9. Regardless, as I have been saying, the setup in stocks is pretty awful, from a technical and fundamental standpoint. But don’t take it from me, ask David Tepper or Stan Druckenmiller. If you do not know who they are, take 5 minutes to find out.
S&P 500
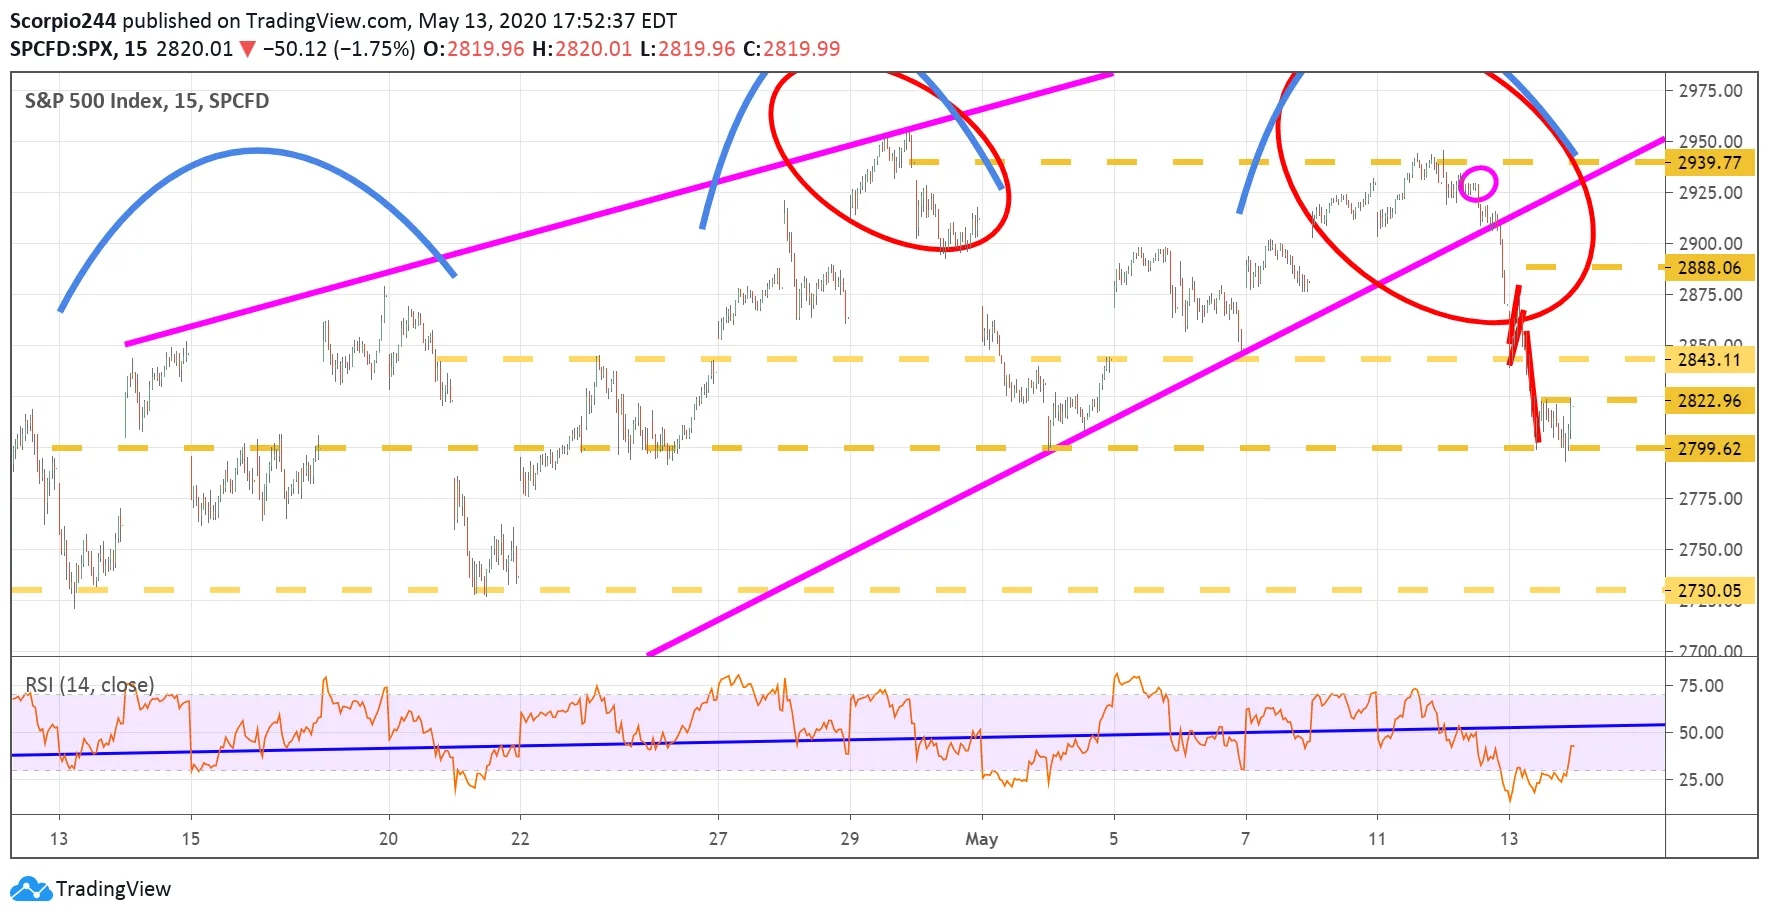
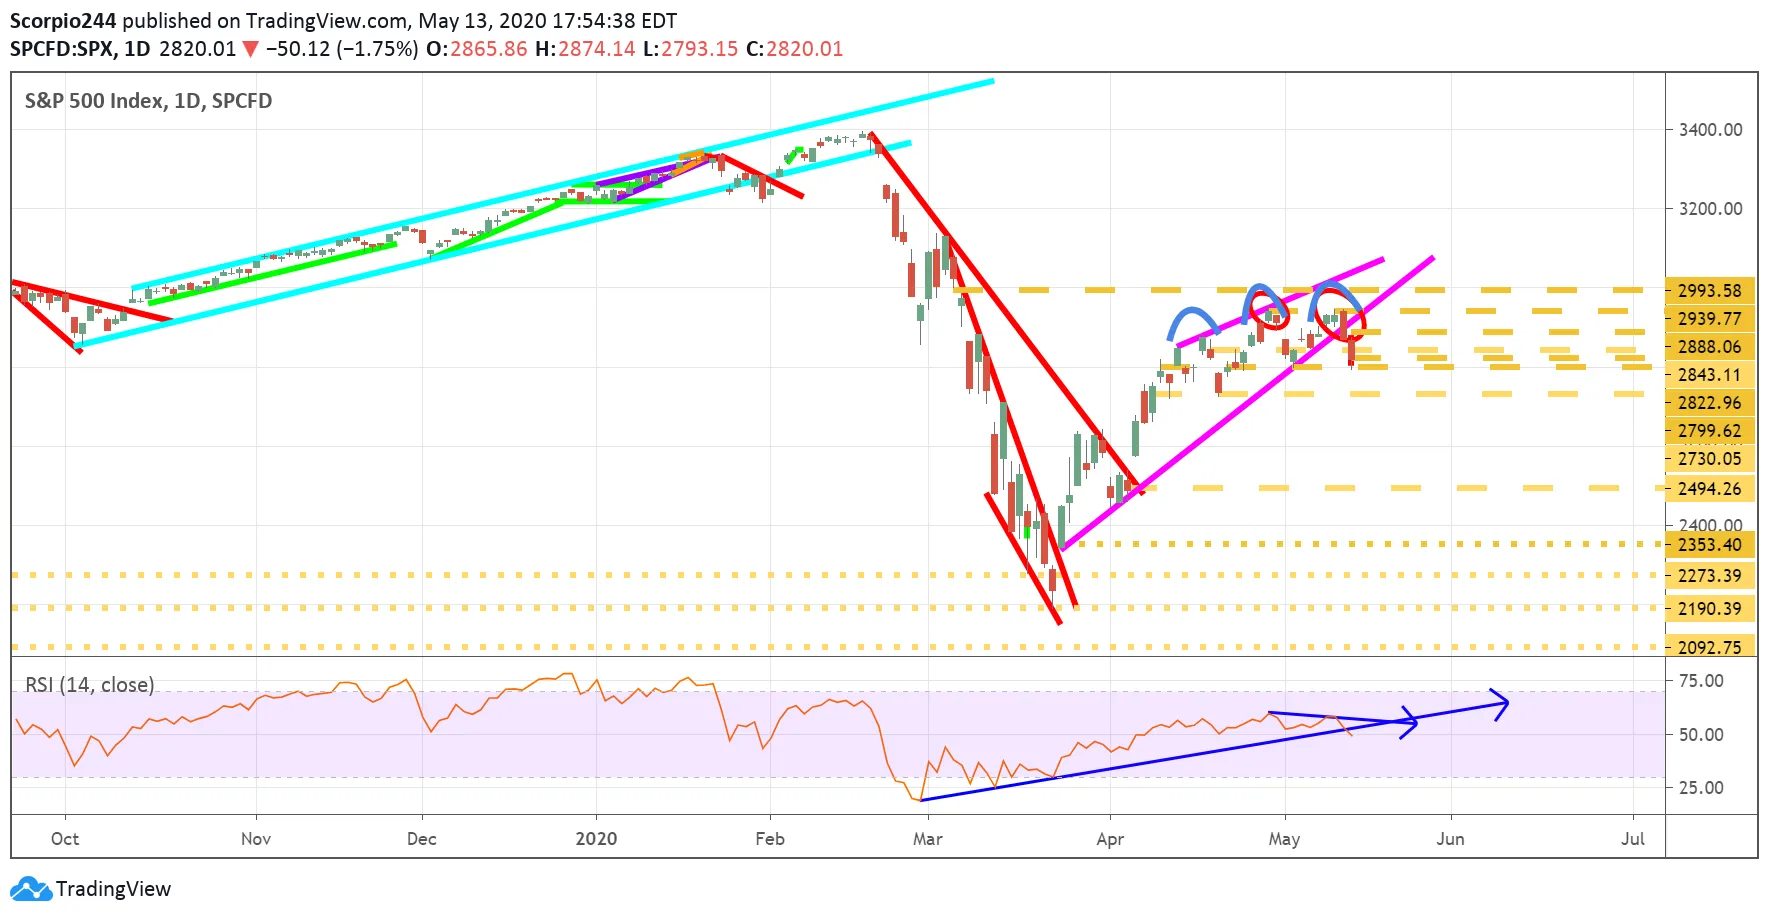
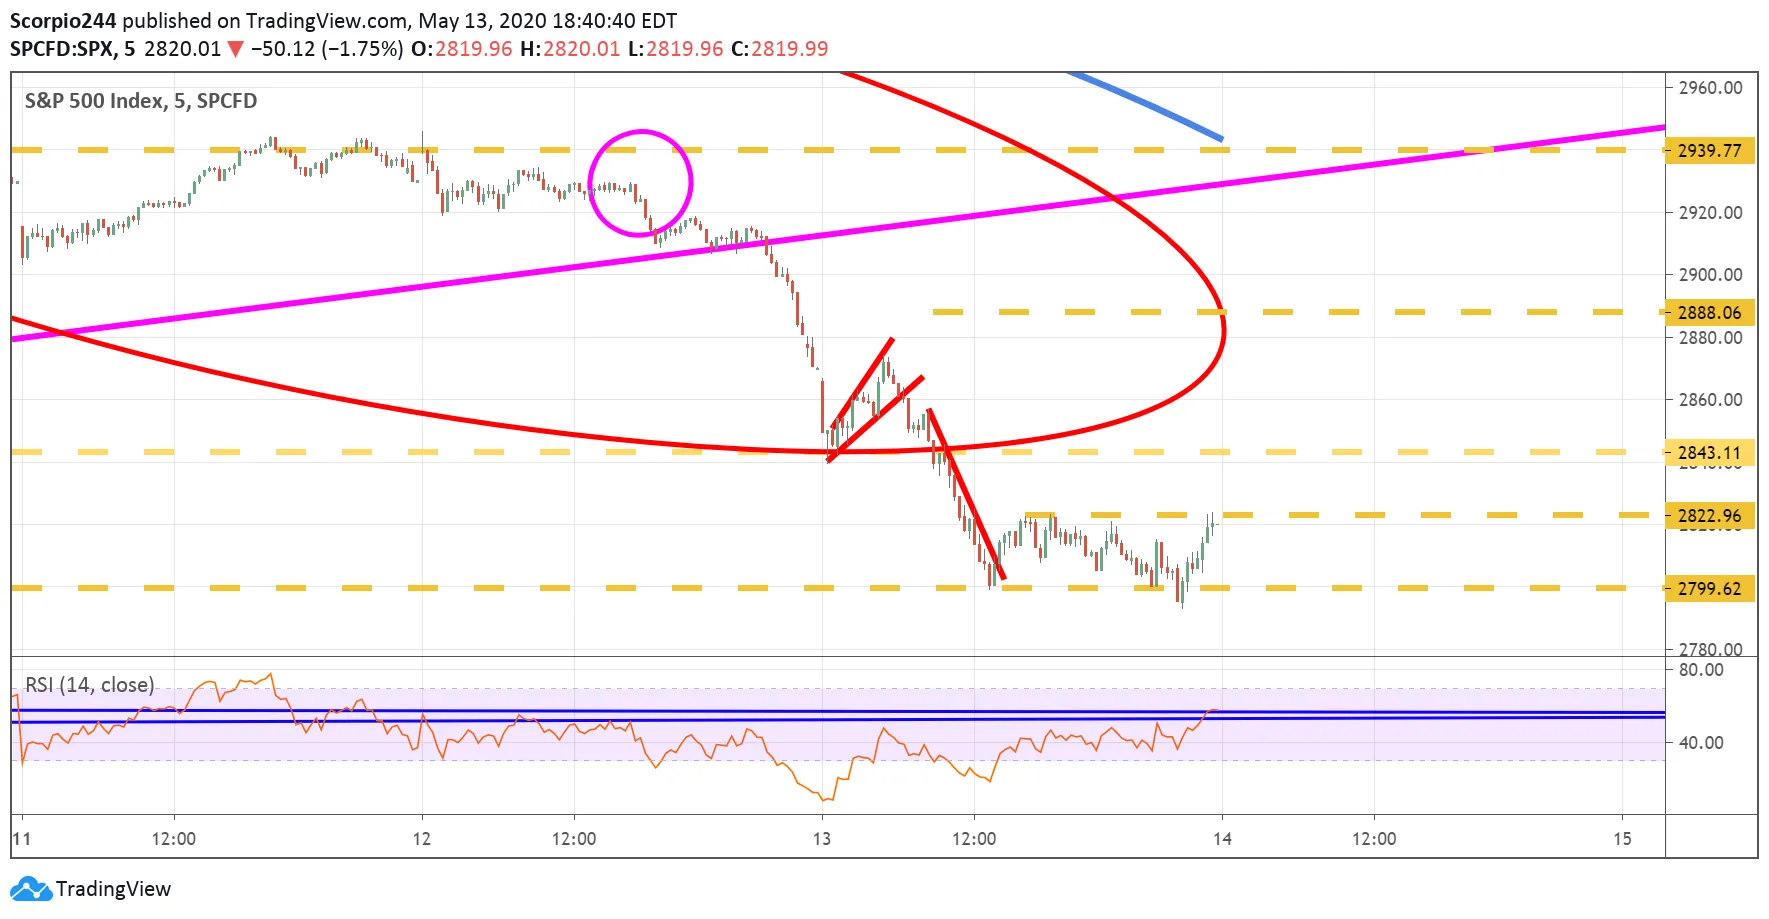
There are at least four bearish patterns I can now identify in the S&P 500, and none of them have a happen ending. The first is a double top pattern with the S&P 500 failing two times around 2840. The index has to fall and close below 2800 to confirm this pattern. The second pattern is a rising wedge; the index fell and closed below that pattern yesterday. The third is a potential head and shoulder pattern, and the fourth is a triple top.
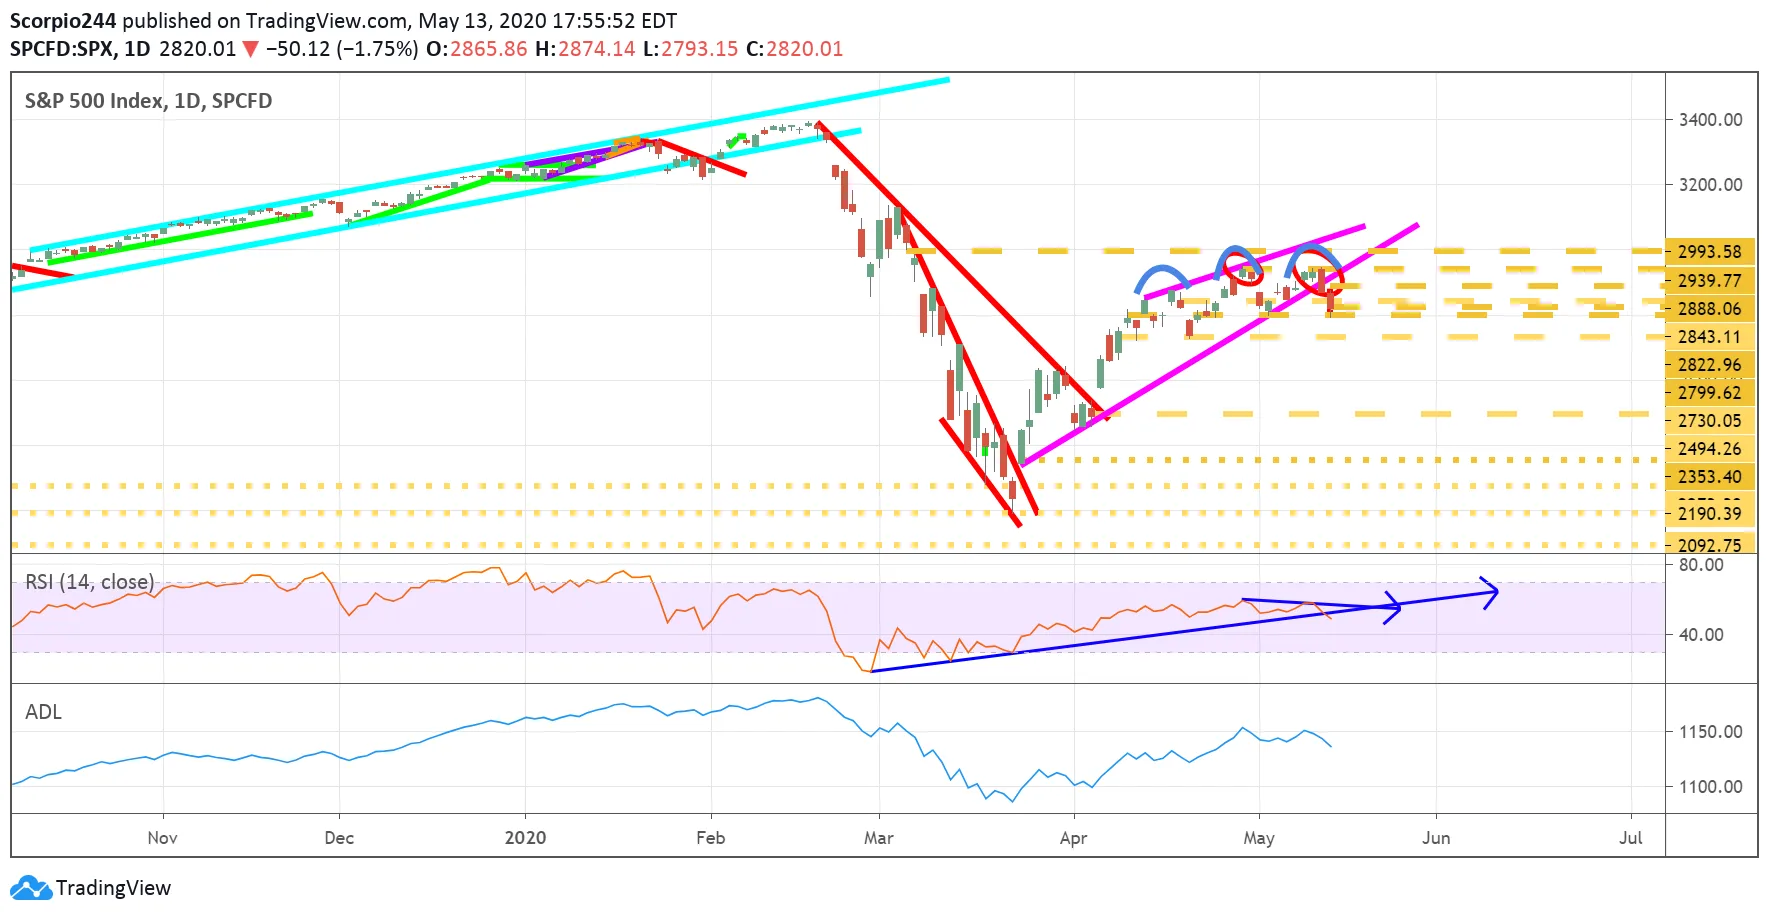
But wait, because it gets even worse. The S&P 500’s RSI yesterday broke the uptrend it is had been following off the March lows. Even worse than that, there is now a downtrend that is forming.
Still worse, the advance-decline is now trending lower.
So we can see that 2,820 became a healthy level of resistance going into the end of the day, while 2,800 acted as support. The bad news is that a break below 2,800 sets up a decline to between 2730 and 2760. But ultimately, I still think we head to 2,500. Sorry, just how I see it.
Financials (XLF)
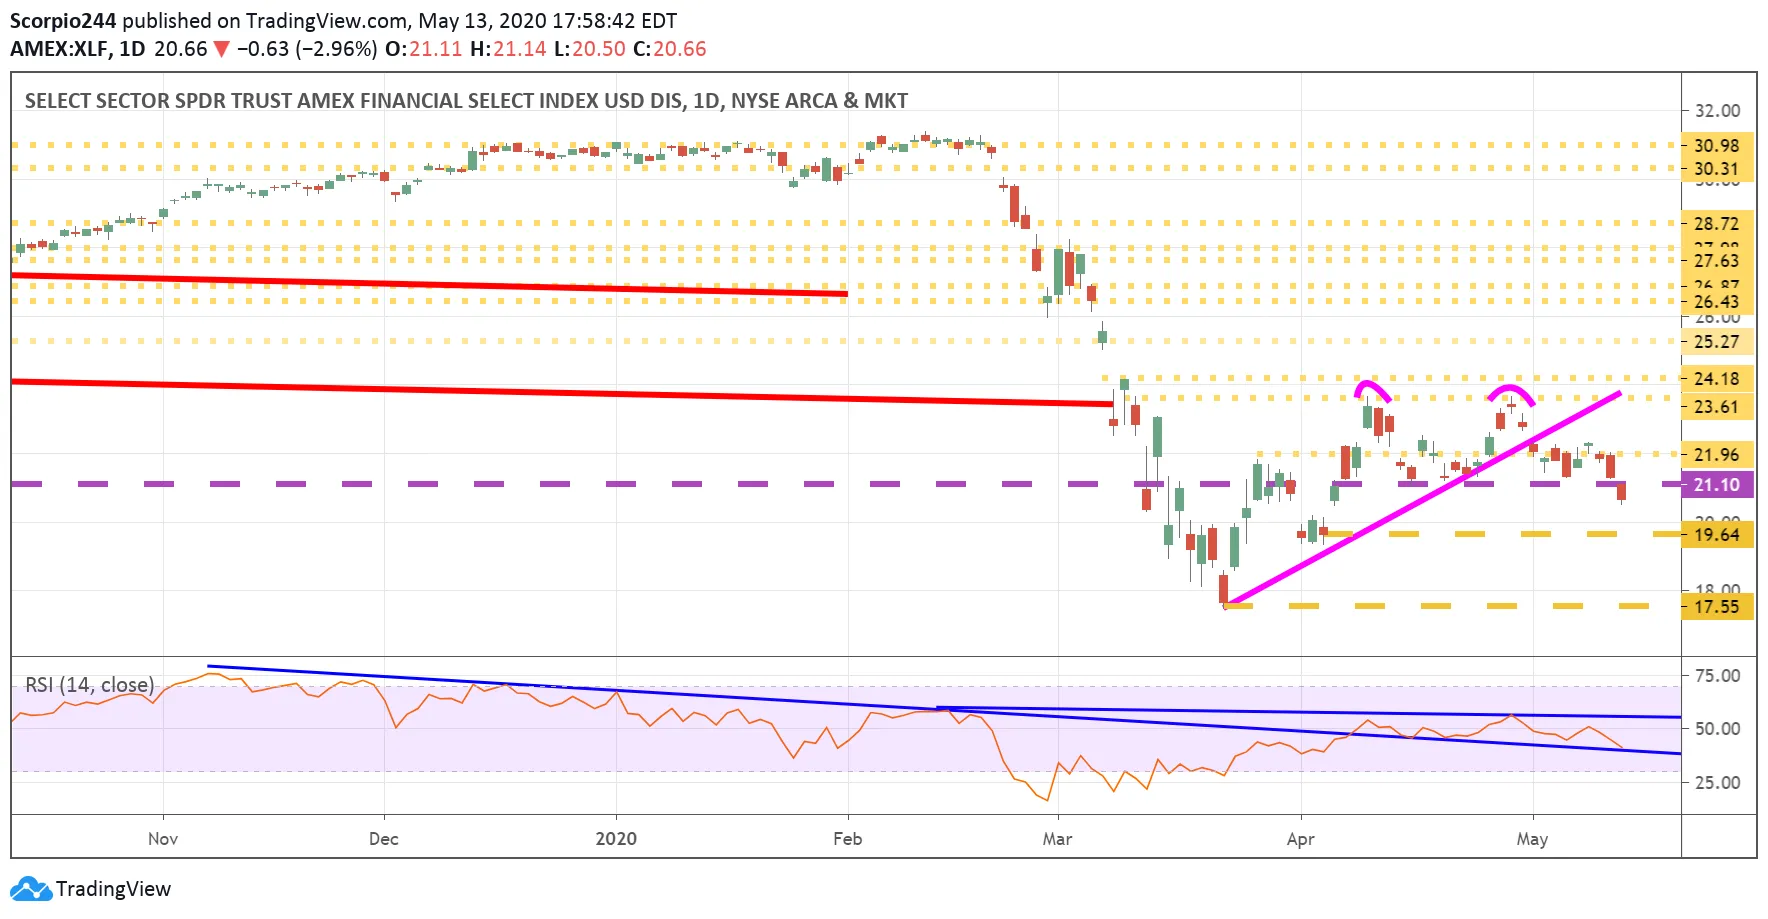
Worst still, the Financial ETF XLF yesterday all but confirmed the double top pattern we have been following, with the ETF falling below $21.10. It sets up a decline to $19.70. Not to mention, I saw a ton of put buying in the ETF.
I could go on; there are ETF’s cracking all over the place. But there is plenty of other stuff to review.
Amazon (AMZN)
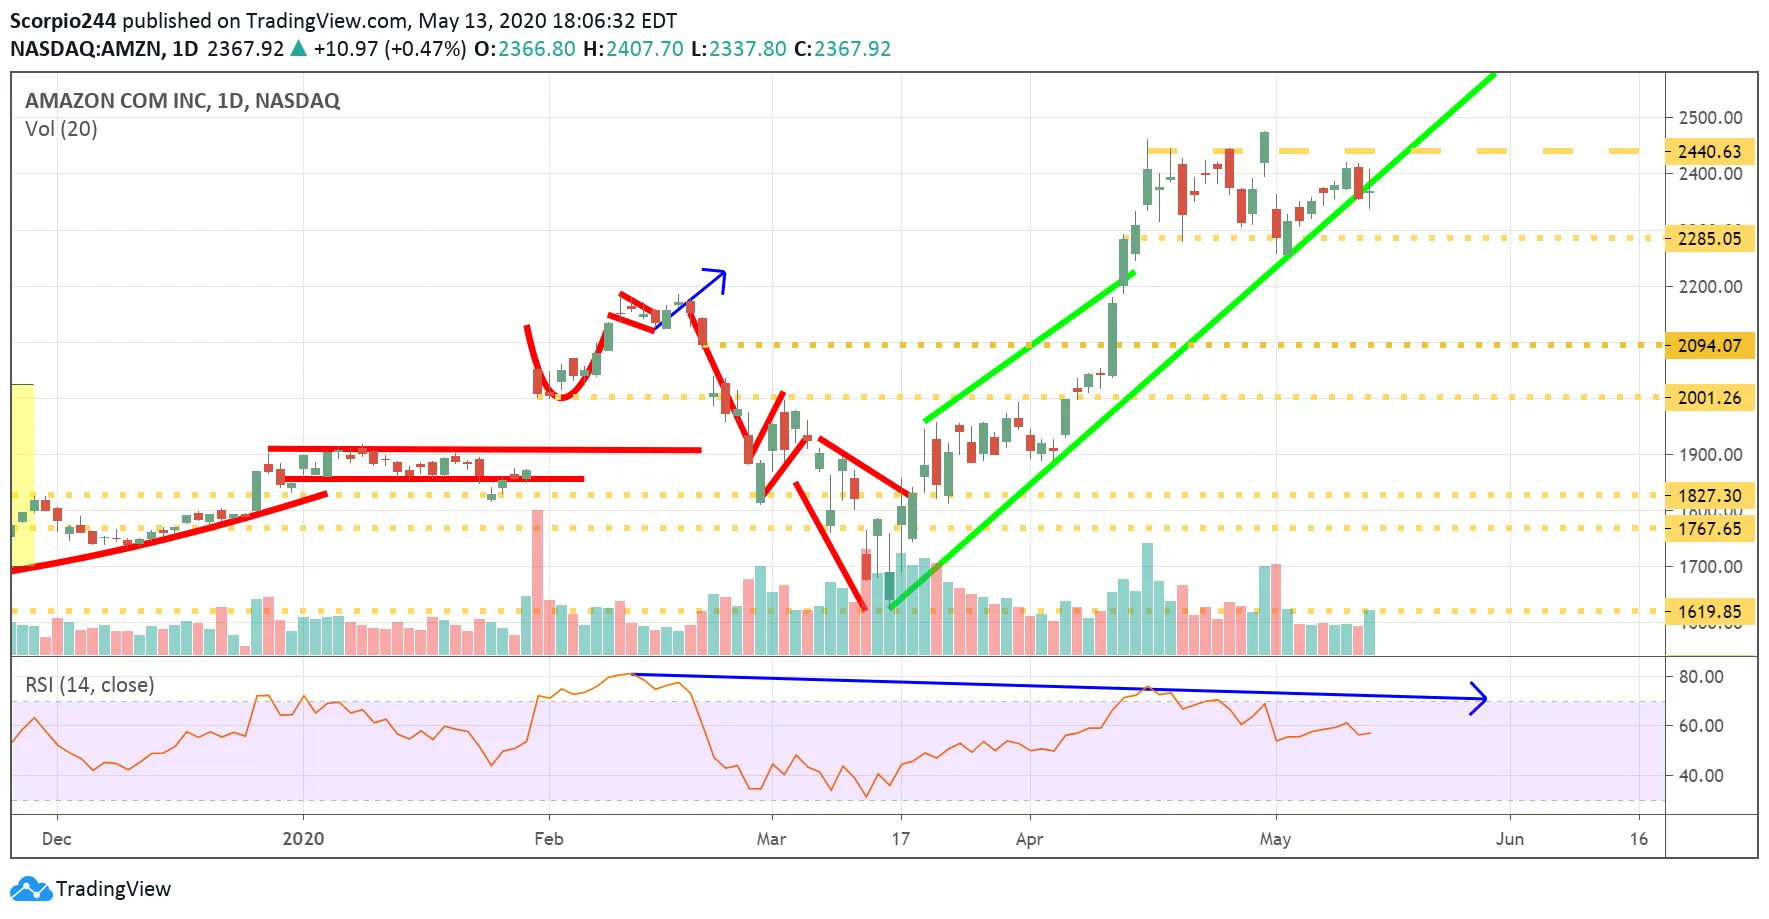
Amazon (NASDAQ:AMZN) Wednesday finished on the other side of the uptrend, and the RSI is still trending lower too. There was a minor uptick in volume. I still think it goes back to $2100, to start.
Facebook (FB)
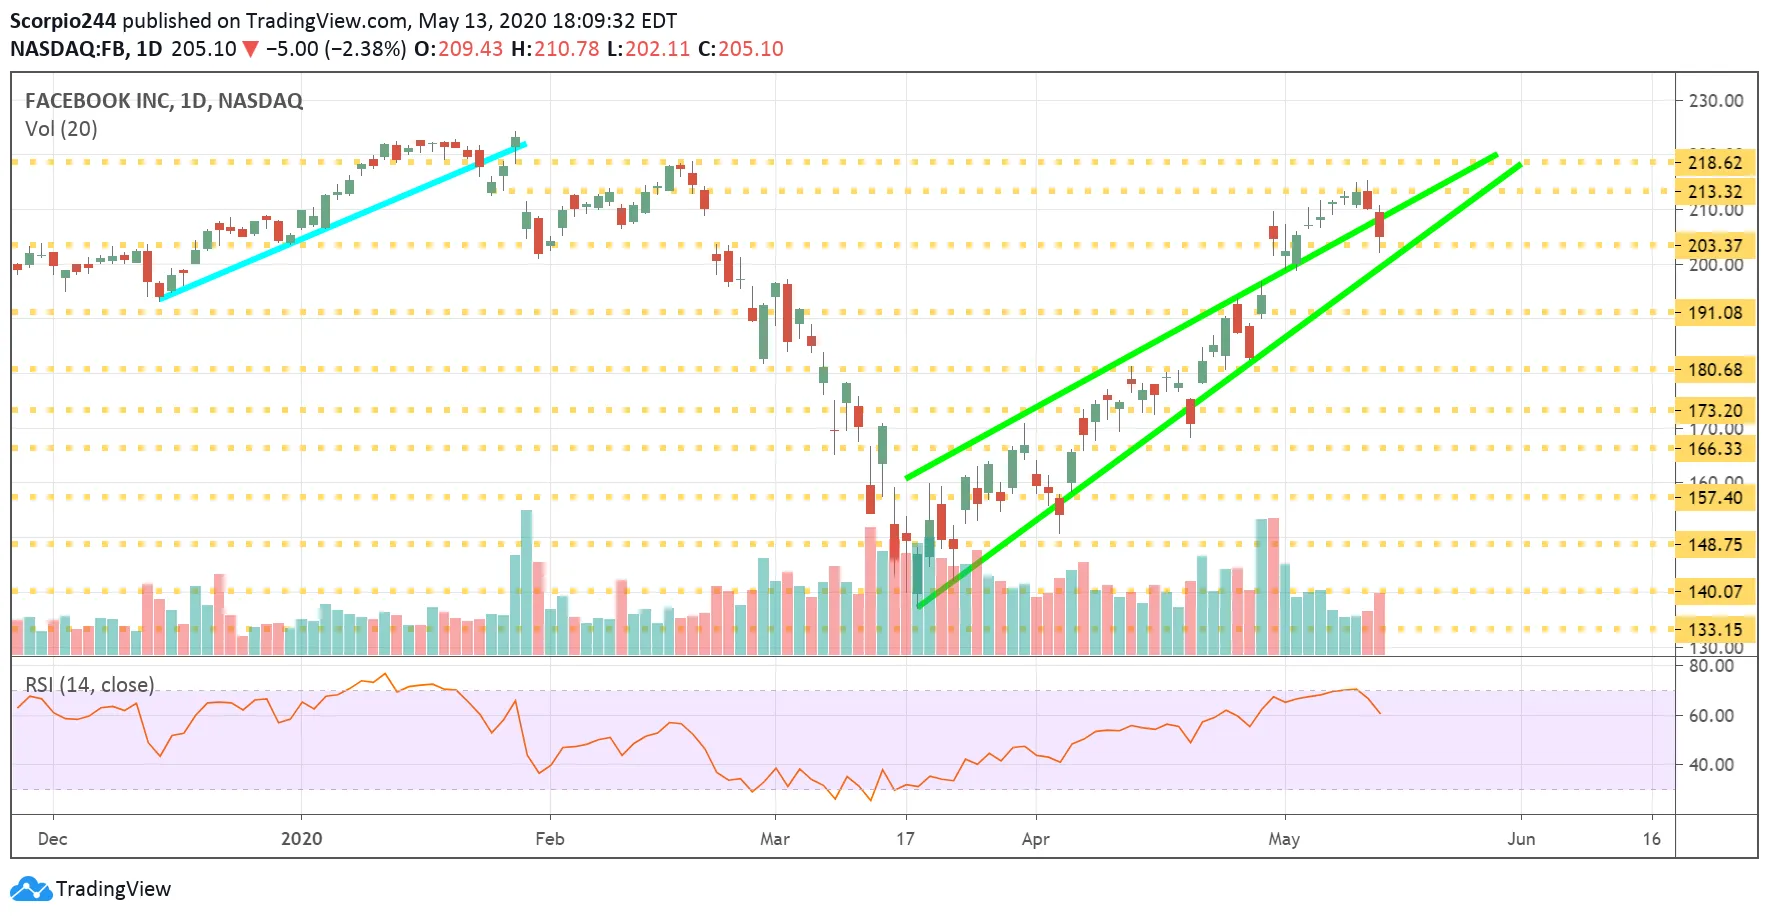
Facebook (NASDAQ:FB) is falling after failing at resistance at $213, and the RSI is now reversing with the stock, along with rising volume. Not a good sign. It likely setups that pullback to $191.
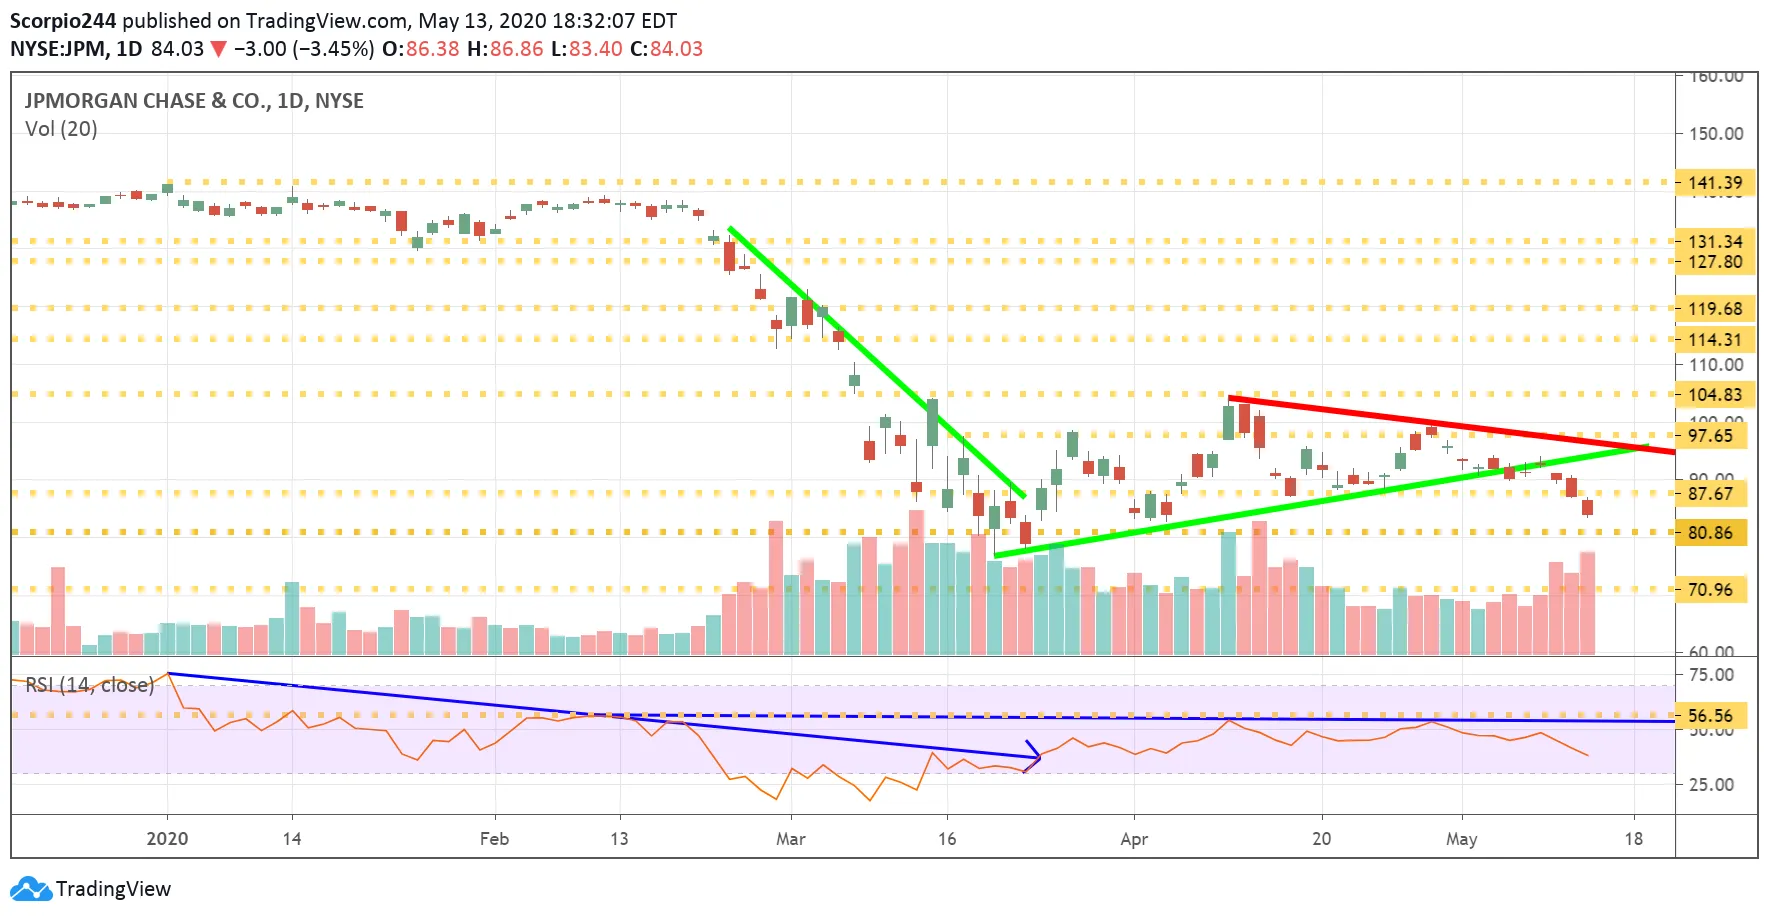
JPMorgan (JPM)
JPMorgan (NYSE:JPM) cracked and stopped for the time at $84, completing a gap fill. But volume is rising fast, and the RSI still has much further to fall with a chance for the stock to push $80.
Honeywell (HON)
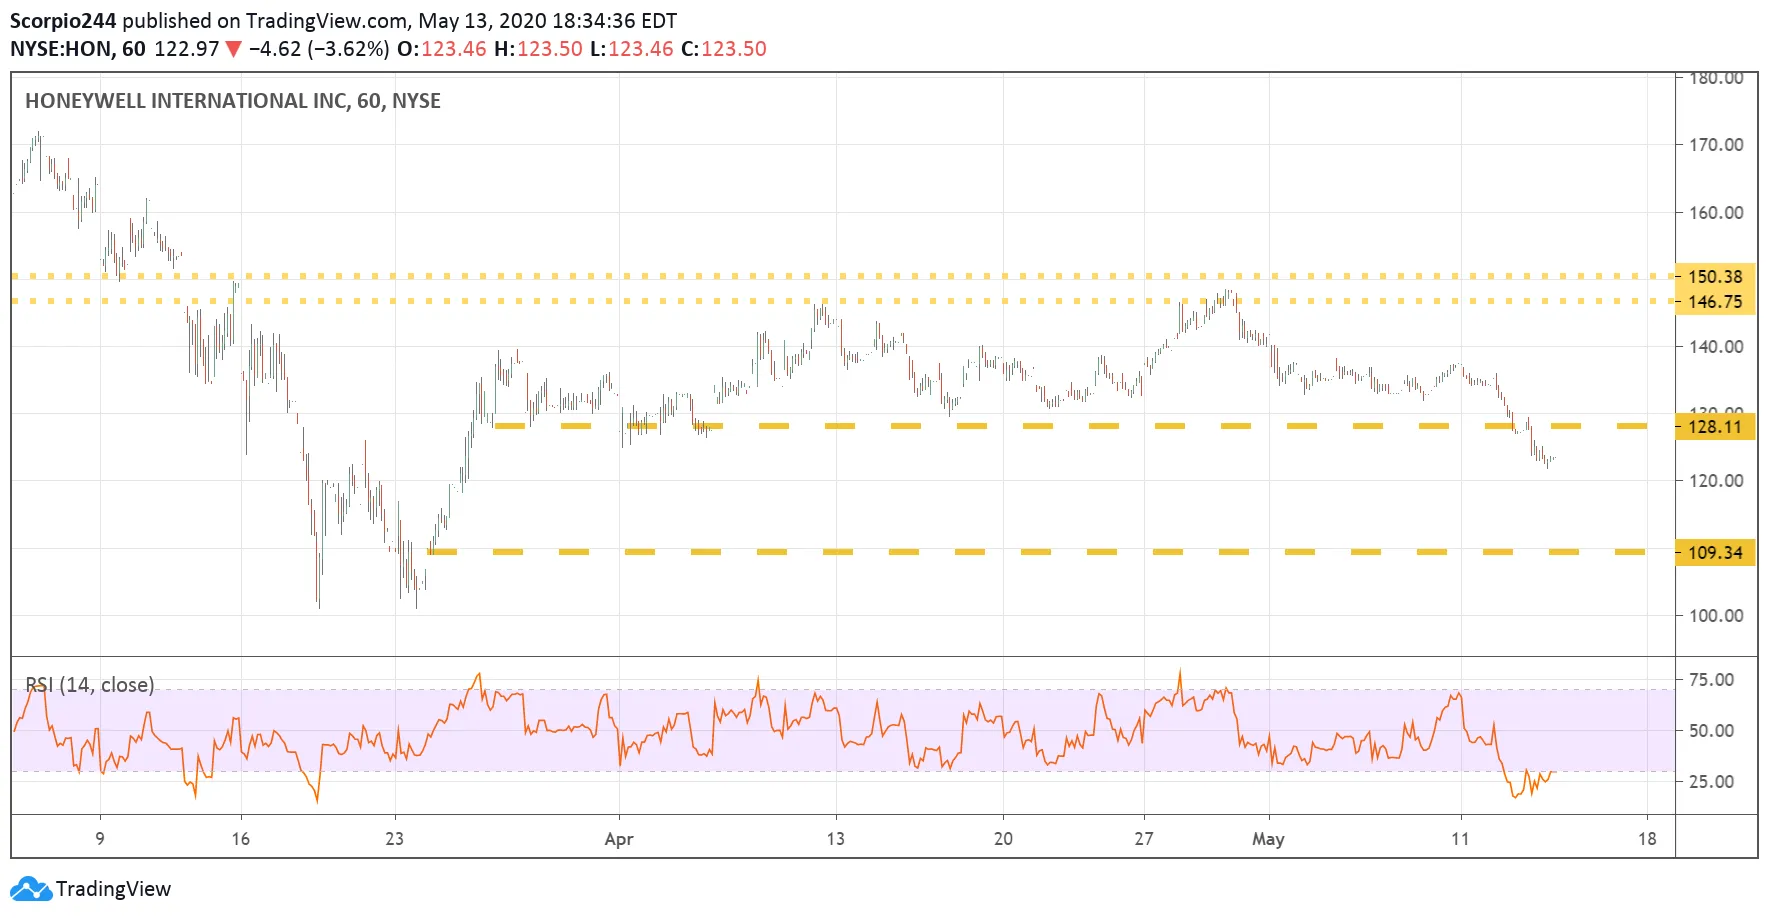
Honeywell (NYSE:HON) broke support yesterday $128, now setting a potential drop to $109.
